



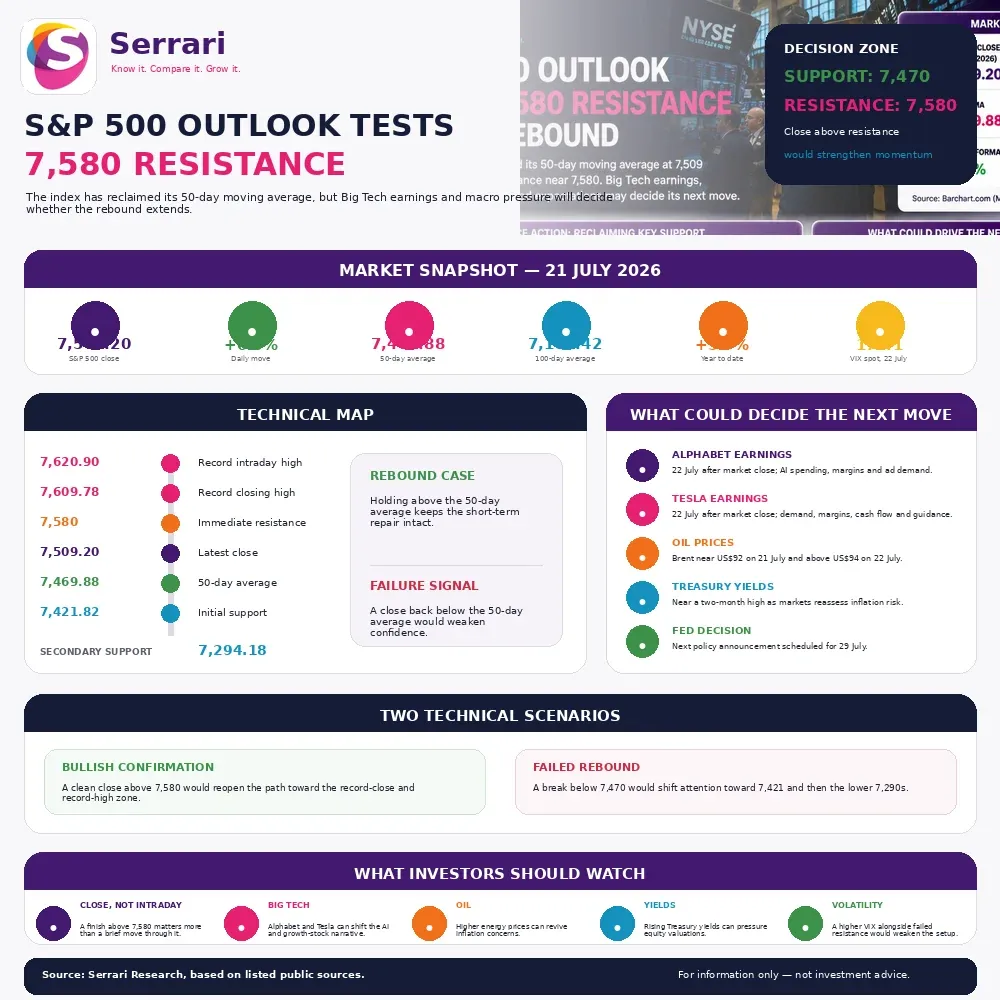
The S&P 500 50-day moving average is a short- to medium-term trend marker watched by technical traders and portfolio managers. The index’s move back above the 50-day average near 7,470 improves the immediate technical picture, but it does not confirm a new breakout by itself. The next confirmation level is resistance around 7,580, with the record close and intraday high just above that zone. If the index fails to hold above the 50-day average, traders may refocus on support near 7,421 and then the lower 7,290s. Earnings from Alphabet and Tesla, oil prices, Treasury yields and Fed expectations may decide whether the rebound holds.
Key Overview
- The S&P 500 closed at 7,509.20 on 21 July.
- The index gained 0.9% on the day.
- The 50-day moving average was approximately 7,469.88.
- The 100-day moving average was approximately 7,158.42.
- Immediate resistance sits around 7,580.
- The record closing high is 7,609.78.
- The record intraday high is 7,620.90.
- The S&P 500 is up 9.7% year-to-date.
- Alphabet and Tesla report earnings after the market close on 22 July.
- The next Federal Reserve decision is scheduled for 29 July. (Barchart.com)
S&P 500 Outlook Tests 7,580 Resistance After Rebound
The Rebound Repaired the First Problem
The S&P 500’s 21 July rebound mattered because it pulled the index back above the 50-day moving average after a short break below it. MarketWatch noted that traders view the 50-day moving average as an important technical support marker and that a quick recovery back above the line was important for equity bulls. (MarketWatch)
That recovery does not automatically restore a strong uptrend. It simply moves the market from a defensive position back into a decision zone. The index has regained support, but it still has to prove that buyers can push through nearby resistance.
The 7,580 Area Is the Next Test
The next technical checkpoint is around 7,580. Business Insider market data places the recent 30-day high near 7,581.50, while the index’s record intraday high sits at 7,620.90. MarketWatch previously identified the record close at 7,609.78. Together, these levels create a tight overhead band where sellers may reappear. (markets.businessinsider.com)
A clean close above this area would strengthen the short-term bullish case. It would suggest the market has absorbed last week’s technology-sector volatility and is ready to retest record territory. Failure near resistance would keep the index range-bound and could invite another test of support.
Support Still Matters
Support levels matter because the rebound remains young. Barchart places the 50-day moving average near 7,469.88 and the 100-day moving average near 7,158.42. The brief’s technical framework identifies initial support around 7,421.82 and secondary support around 7,294.18, with Business Insider market data also showing a recent one-month low at 7,294.18. (Barchart.com)
This means the decision zone is fairly clear. Holding above the 50-day average supports the rebound case. Falling back below it would weaken confidence, especially if the decline follows disappointing earnings or another jump in oil and bond yields.
Big Tech Earnings Are the Catalyst
The technical setup is arriving just as Big Tech earnings come into view. Alphabet and Tesla are scheduled to report after the market close on 22 July, with investors watching artificial-intelligence spending, margins, cash flow and demand signals. (Yahoo Finance)
This matters because technology and AI-linked shares have been central to the market’s leadership. If Alphabet’s results support the AI spending story and Tesla’s guidance reassures investors, the index could have enough momentum to challenge 7,580. If the results disappoint, the 50-day average could become vulnerable again.
Oil and Inflation Add Pressure
The equity rebound is not happening in a calm macro backdrop. AP reported that rising oil prices linked to conflict involving Iran pushed Brent crude close to $92 on 21 July and contributed to higher Treasury yields. MarketWatch separately noted that Brent crude had moved above $94 on 22 July, keeping inflation concerns alive and leaving the 10-year Treasury yield near a two-month high. (AP News)
Higher oil prices can complicate the equity outlook because they raise questions about inflation, household spending and the Federal Reserve’s next move. That is especially important when valuations are already sensitive to interest-rate expectations.
Context is everything. Stay ahead of shifting trends with today’s market updates, and uncover emerging opportunities using the Serrari Group Market Index and Marketplace. Then, take control of your own financial future by exploring our Money & Life Reset Transformation Blueprint ™ to build stronger habits, create better systems, and design a path toward lasting wealth.
Fed Expectations Remain in Play
The next Federal Reserve decision is scheduled for 29 July. CME’s FedWatch tool tracks market-implied probabilities from 30-day Fed Funds futures, making it a key reference for how traders are pricing the next policy move. (CME Group)
For the S&P 500, the Fed matters through discount rates, Treasury yields and earnings multiples. A market that expects steady or easier policy may be more willing to pay high valuations for growth stocks. A market that fears tighter policy because of oil-driven inflation may be less forgiving.
Volatility Is Still Worth Watching
The VIX index is another useful signal. Cboe describes the VIX as a leading measure of market expectations for near-term volatility derived from S&P 500 option prices. On 22 July, Cboe showed the VIX spot price around 17.41, indicating that broad index volatility was not flashing panic even as technology and oil risks remained active. (Cboe Global Markets)
That calm can support risk appetite, but it can also create vulnerability if a negative earnings surprise or macro shock arrives. Low or moderate volatility does not eliminate downside risk; it only shows what options markets are pricing at that moment.
Why the S&P 500 Signal Matters Globally
The S&P 500 is not just a US benchmark. S&P Dow Jones Indices describes it as the best single gauge of large-cap US equities, with 500 leading companies covering about 80% of available US equity-market capitalisation. That makes its trend relevant to global index funds, ETFs, retirement portfolios and international risk appetite. (S&P Global)
A breakout above resistance could strengthen the case for risk-on positioning. A failure back below the 50-day average could push investors toward cash, defensive sectors, short-duration bonds or lower-beta assets.
What Investors Should Watch Next
Investors should watch whether the index can close above 7,580, not merely trade near it intraday. They should also watch whether Alphabet and Tesla earnings support the broader AI and growth-stock narrative.
The second watchpoint is oil. If energy prices keep rising, inflation concerns may pressure Treasury yields and equity valuations. The third is volatility. A rising VIX alongside a failed resistance test would make the rebound look weaker.
Conclusion
The S&P 500 Outlook has improved after the index reclaimed its 50-day moving average and closed at 7,509.20. But the next test is tougher. The index must clear resistance near 7,580 before the rebound looks like a renewed momentum move rather than a short-term repair rally.
Investors should treat the next few sessions as a confirmation window. Big Tech earnings, oil prices, Treasury yields and the Fed path could all shift the setup quickly. The technical picture is constructive above the 50-day average, but it is not fully bullish until resistance gives way.
FAQs
1. Why is the S&P 500 Outlook important this week?
The S&P 500 Outlook is important because the index has reclaimed its 50-day moving average but remains below resistance near 7,580 and below its record levels. Alphabet and Tesla earnings, oil prices and expectations for the 29 July Federal Reserve decision could decide whether the rebound continues or fails.
2. What is the S&P 500 50-day moving average?
The 50-day moving average is the average closing level of the index over the past 50 trading days. Technical traders use it as a short- to medium-term trend marker. Barchart placed the S&P 500’s 50-day average at about 7,469.88 after the 21 July close. (Barchart.com)
3. What resistance level is the S&P 500 facing?
The main resistance area is around 7,580, close to recent highs and below the record closing high of 7,609.78 and record intraday high of 7,620.90. A clean close above this area would strengthen the bullish technical case. (markets.businessinsider.com)
4. What could weaken the rebound?
The rebound could weaken if Alphabet or Tesla disappoint investors, oil prices push inflation expectations higher, Treasury yields rise further, or the index falls back below the 50-day moving average. A break below initial support near 7,421 would make the setup more defensive.
5. Why does the S&P 500 matter beyond US investors?
The S&P 500 matters globally because it is widely used by US and international index funds, ETFs, retirement portfolios and institutional investors. S&P Dow Jones Indices says the benchmark covers about 80% of available US equity-market capitalisation, making it a major gauge of global risk appetite. (S&P Global)
Sources: AP News, Barchart, MarketWatch, S&P Global, Business Insider Markets, Cboe, CME Group, Yahoo Finance
Your financial future isn’t something you wait for—it’s something you build.
The real question is: when do you begin?
Move beyond simply staying informed.
Navigate the markets with clarity—track trends through the Serrari Group Market Index, uncover opportunities in the Serrari Marketplace, and build practical knowledge with our Curated Wealth Builder Platform.
Stay connected to what truly matters.
Get daily insights on macro trends and financial movements across Kenya, Africa, and global markets—delivered through the Serrari Newsletter.
Growth opens doors.
Advance your career through professional programs including ACCA, HESI A2, ATI TEAS 7 , HESI EXIT , NCLEX – RN and NCLEX – PN, Financial Literacy!🌟—designed to move you forward with confidence.
See where money is flowing—clearly and in real time.
Track Money Market Funds, Treasury Bills, Treasury Bonds, Green Bonds, and Fixed Deposits, alongside global and African indexes, key economic indicators, and the evolving Crypto and stablecoin landscape—all within Serrari’s Market Index.