



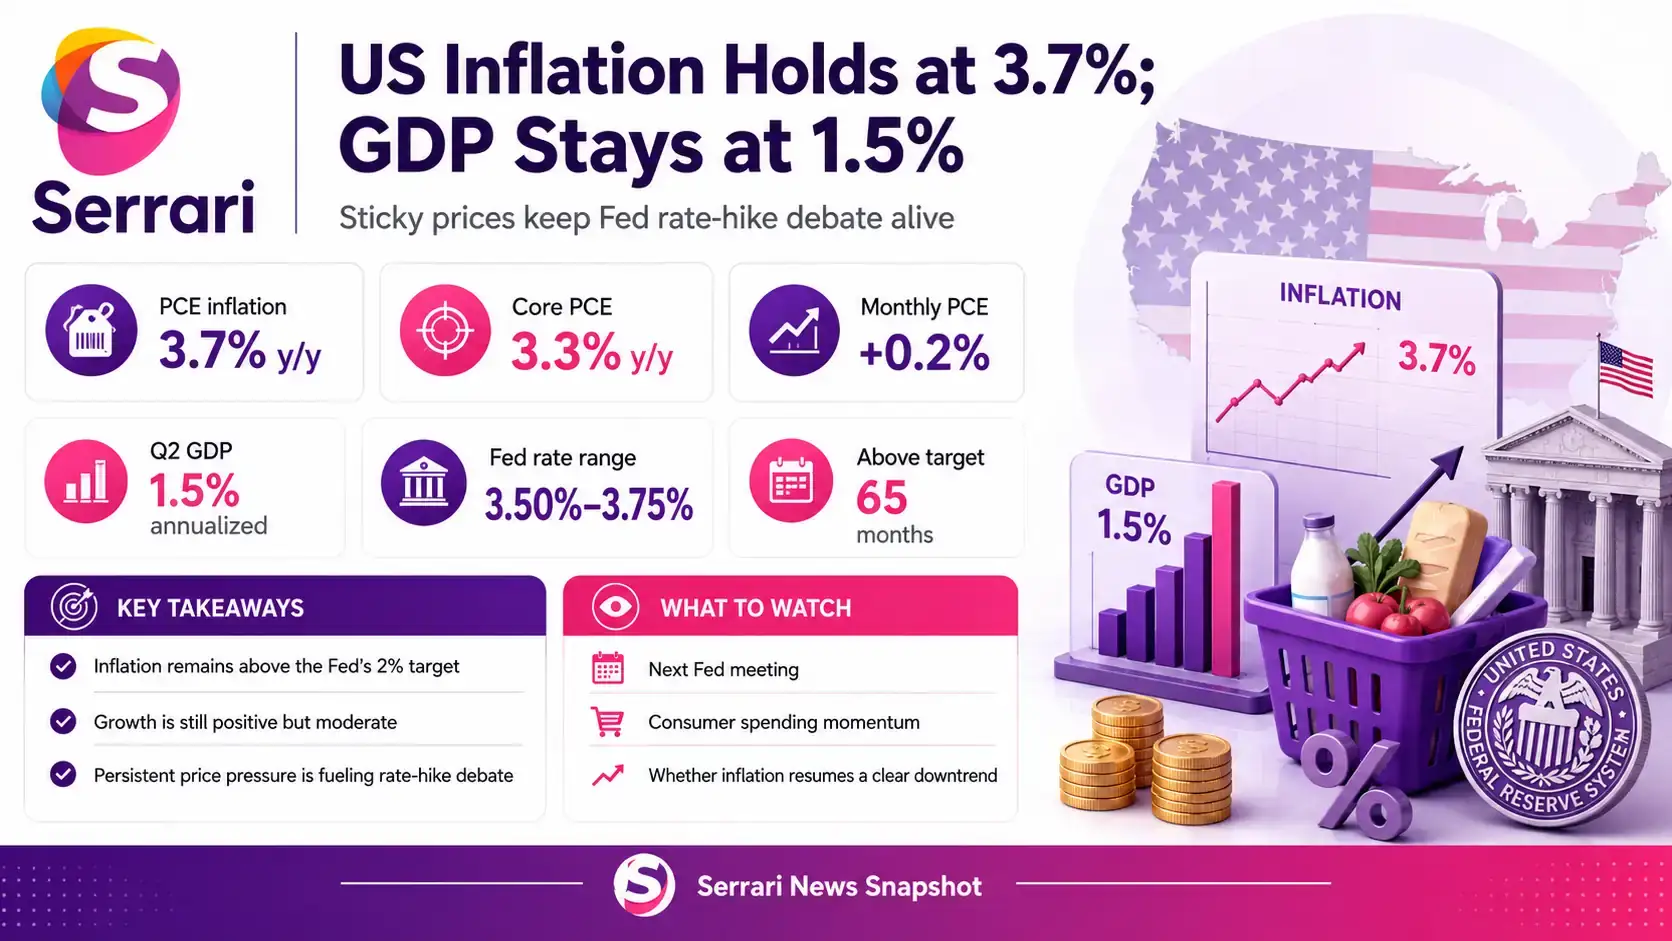
U.S. inflation remained stubbornly above the Federal Reserve’s target in July, with the Personal Consumption Expenditures price index rising 3.7% from a year earlier, unchanged from June. Core PCE inflation, which excludes food and energy, also held at 3.3%, reinforcing concerns that price pressures are easing only slowly.
At the same time, the economy continued to expand at a moderate pace. Second-quarter real GDP growth was left unrevised at an annualized 1.5%, even as stronger consumer spending and corporate profits suggested that underlying private-sector demand remained resilient.
Key Overview
- Headline PCE inflation held at 3.7% year on year in July, above the Fed’s 2% target.
- Core PCE inflation remained at 3.3%.
- Both headline and core PCE prices rose 0.2% from June.
- Real consumer spending was essentially flat in July after adjusting for inflation.
- Q2 GDP growth remained unrevised at an annualized 1.5%.
- Consumer spending growth in Q2 was revised up to 3.4% from 3.2%.
- The Fed kept rates at 3.50%–3.75% in July, but three policymakers voted for a 25-basis-point increase.
Inflation Progress Stalls Above the Fed’s Target
The latest July PCE data showed that the Fed’s preferred inflation gauge increased 0.2% from the previous month and 3.7% from a year earlier. Core PCE also rose 0.2% on the month and 3.3% annually, indicating that underlying inflation remains well above the central bank’s 2% objective.
The annual headline rate has now remained above target for 65 consecutive months. The July reading was also slightly higher than economists had expected, with a 3.6% consensus forecast before the release.
Inflation has eased from the 4.1% three-year high reached in May, when energy prices surged amid the Middle East conflict. However, the pace of improvement has slowed, leaving policymakers with limited evidence that inflation is returning decisively toward target.
Consumer Spending Loses Momentum in July
Household spending increased in nominal terms, but inflation absorbed most of the gain. The official income and spending report showed personal consumption expenditures rising 0.2% in current dollars while real PCE was effectively unchanged.
Personal income rose 0.4%, while disposable personal income increased 0.5%. The personal saving rate reached 3.0%, suggesting households received a modest improvement in income even as spending growth cooled.
The composition of spending was also notable. Services spending increased by $86.2 billion, while goods spending fell by $49.9 billion, pointing to continued strength in service-sector demand but weaker purchases of physical goods.
Context is everything. Stay ahead of shifting trends with today’s market updates, and uncover emerging opportunities using the Serrari Group Market Index and Marketplace. Then, take control of your own financial future by exploring our Money & Life Reset Transformation Blueprint ™ to build stronger habits, create better systems, and design a path toward lasting wealth.
Fed Debate Shifts Toward Whether Rates Need to Rise
Persistent inflation is intensifying disagreement inside the Federal Reserve. At its July meeting, the central bank kept the federal funds rate in a 3.50%–3.75% target range, but the decision passed by a 9–3 vote.
Beth Hammack, Neel Kashkari and Lorie Logan dissented because they preferred a quarter-percentage-point rate increase. The unusual level of dissent highlights the growing concern among some officials that existing monetary restraint may not be sufficient to return inflation to 2%.
After the July inflation release, futures markets priced roughly a 40% probability of a rate increase at the Fed’s September meeting, up modestly from about 36% beforehand.
GDP Holds at 1.5% but Private Demand Looks Stronger
The second estimate for economic growth left Q2 real GDP unchanged at a 1.5% annualized rate, down from 2.1% in the first quarter.
However, the details were stronger than the headline number suggested. Consumer spending growth was revised upward to 3.4% from 3.2%, while final sales to private domestic purchasers were revised to 4.2%, the strongest rate since early 2023.
Corporate profits also increased sharply, rising by $400.9 billion during the quarter after a $74.4 billion gain in the first quarter. Gross domestic income grew at a 2.2% annualized pace, compared with 1.2% previously.
These figures suggest that private-sector activity remains relatively firm even as headline GDP growth slows.
What the Data Means for the U.S. Outlook
The combination of sticky inflation and resilient private demand complicates the Fed’s next decision. A weakening economy would normally create room for lower rates, but stronger household demand, business investment and profits reduce the urgency for monetary easing.
At the same time, inflation remains too high for policymakers to declare victory. Energy shocks, tariffs and other supply pressures continue to cloud the outlook, while the persistence of core inflation raises the risk that price growth remains elevated even after temporary shocks fade.
The next phase of U.S. monetary policy will therefore depend on whether inflation resumes a convincing downward trend or whether the July stall becomes evidence that further tightening is needed.
Sources: Reuters / U.S. Bureau of Economic Analysis / Federal Reserve
Your financial future isn’t something you wait for—it’s something you build.
The real question is: when do you begin?
Move beyond simply staying informed.
Navigate the markets with clarity—track trends through the Serrari Group Market Index, uncover opportunities in the Serrari Marketplace, and build practical knowledge with our Curated Wealth Builder Platform.
Stay connected to what truly matters.
Get daily insights on macro trends and financial movements across Kenya, Africa, and global markets—delivered through the Serrari Newsletter.
Growth opens doors.
Advance your career through professional programs including ACCA, HESI A2, ATI TEAS 7 , HESI EXIT , NCLEX – RN and NCLEX – PN, Financial Literacy!🌟—designed to move you forward with confidence.
See where money is flowing—clearly and in real time.
Track Money Market Funds, Treasury Bills, Treasury Bonds, Green Bonds, and Fixed Deposits, alongside global and African indexes, key economic indicators, and the evolving Crypto and stablecoin landscape—all within Serrari’s Market Index.