




The BSE REITs Index gives investors a dedicated benchmark for India’s listed real-estate investment trusts without mixing them with ordinary property-development companies.
As of 31 July 2026, the back-calculated index showed a one-year total return of 18.54%, compared with a price return of 11.66%. The 6.88-percentage-point difference illustrates why distributions are an important part of REIT performance, although it should not be interpreted simply as the dividend yield.
The benchmark currently contains only six REITs and remains concentrated. Embassy Office Parks REIT carries a 32.18% weight, while Embassy, Brookfield India and Nexus Select together account for approximately 76.82%.
For investors, the new index provides a clearer way to measure listed-property performance, but India’s relatively small REIT universe means diversification remains limited.
Key Overview
- BSE Index Services launched the BSE REITs Index on 7 August 2026.
- The benchmark contains six listed Indian REITs.
- Its back-calculated one-year total return was 18.54% as of 31 July.
- The one-year price return was 11.66%.
- The difference between the two measures was 6.88 percentage points.
- The index had a dividend yield of approximately 5.75%.
- Embassy Office Parks REIT is the largest constituent at 32.18%.
- Brookfield India Real Estate Trust carries a 23.44% weight.
- Nexus Select Trust represents 21.20%.
- The top three REITs together represent approximately 76.82% of the benchmark.
- The index uses capped free-float-adjusted market-capitalisation weighting.
- It will be reconstituted semi-annually in March and September.
- Historical index performance before launch is back-calculated and was not earned by a live index product.
BSE REITs Index Launches With 18.54% One-Year Return
India’s listed real-estate investment trust market now has a dedicated benchmark after BSE Index Services launched the BSE REITs Index on 7 August 2026.
The Economic Times current index launch report says the benchmark contains six listed REITs and is designed specifically to measure the performance of India’s exchange-traded real-estate trusts.
Unlike broader real-estate indexes, the new benchmark does not combine REITs with conventional property developers.
That distinction matters because the two types of investment generate returns differently.
A property developer may earn money by buying land, constructing buildings and selling units.
A REIT generally owns income-generating property and distributes a significant part of the cash generated from those assets to its unitholders.
For investors, the new index therefore provides a cleaner measure of India’s listed income-producing property market.
Six REITs Make Up the Benchmark
The BSE REITs Index currently contains six trusts:
- Embassy Office Parks REIT;
- Brookfield India Real Estate Trust;
- Nexus Select Trust;
- Mindspace Business Parks REIT;
- Bagmane Prime Office REIT; and
- Knowledge Realty Trust.
Their weights are not equal.
Embassy Office Parks REIT represents 32.18% of the index.
Brookfield India Real Estate Trust accounts for 23.44%, while Nexus Select Trust carries a 21.20% weight.
Mindspace Business Parks REIT represents 11.57%.
The two smallest positions are Bagmane Prime Office REIT at 6.53% and Knowledge Realty Trust at 5.07%.
The BSE REITs Index launch details show that the benchmark uses capped free-float-adjusted market-capitalisation weighting rather than giving every trust the same allocation.
This means larger and more freely tradeable REITs generally have more influence on index performance.
Total Return Tells a Different Story
The most interesting figure is not simply the index’s one-year gain.
It is the difference between its price return and total return.
As of 31 July 2026, the back-calculated Total Return Index stood at 1,469.77 and showed a one-year return of 18.54%.
The Price Return Index stood at 1,159.66 and recorded a one-year return of 11.66%.
That creates a difference of approximately 6.88 percentage points.
The gap helps demonstrate why distributions are important when measuring REIT performance.
A price-only index measures changes in the market prices of the underlying REIT units.
A total-return index assumes distributions are reinvested back into the portfolio.
For an income-producing asset class such as REITs, excluding distributions can therefore leave out a significant part of the investment experience.
The 6.88-Point Gap Is Not the Dividend Yield
The difference between the 18.54% total return and the 11.66% price return should not be described simply as a 6.88% dividend yield.
The reported index dividend yield was approximately 5.75%.
The figures differ because total-return calculations also reflect:
- The timing of distributions;
- Reinvestment dates;
- Changes in constituent weights;
- Movements in unit prices after distributions;
- Index methodology; and
- Compounding.
The 5.75% yield is a snapshot based on current index characteristics.
The 18.54% total return measures performance over an entire year.
They answer different questions.
For investors assessing REITs, the broader lesson is that looking only at changes in unit prices can understate the role that recurring distributions play in overall returns.
REITs Turn Property Income Into Units
A REIT allows investors to gain exposure to large income-producing properties without purchasing those buildings directly.
The SEBI investor guide to REITs explains that REITs pool investor capital and deploy it into real-estate assets that generate income.
Investors hold listed units that can be bought and sold on an exchange.
The underlying portfolios may include:
- Office parks;
- Business campuses;
- Shopping centres;
- Hotels;
- Warehouses;
- Retail property; and
- Other income-generating real estate.
This makes REITs different from purchasing a physical apartment, office or shop.
A direct property investor must normally provide substantial capital, manage the asset and find a buyer when they want to exit.
A listed REIT gives investors access through exchange-traded units and professional property management.
Distributions Are Central to REIT Investing
Rental income is one of the main reasons investors consider REITs.
After property expenses, financing costs and other obligations are paid, part of the distributable cash generated by the trust can be returned to unitholders.
Indian listed REITs have become increasingly significant income distributors.
Existing market data showed that five listed Indian REITs distributed more than ₹8,900 crore to unitholders during FY2026.
For investors, these distributions can provide a recurring income component alongside movements in the REIT unit price.
This is why total-return performance is particularly relevant.
A REIT whose unit price rises by 10% and also makes meaningful distributions has produced a different investment result from a property stock that gains 10% without returning cash to shareholders.
The BSE benchmark makes that distinction easier to observe.
Concentration Is the Main Limitation
Although the new index creates diversification across six trusts, it remains highly concentrated.
Embassy represents 32.18% of the benchmark.
Adding Brookfield India’s 23.44% and Nexus Select’s 21.20% brings the combined weight of the top three to approximately 76.82%.
The remaining three trusts account for only around 23.18%.
This means the index can contain six names while still receiving most of its performance from three.
If Embassy, Brookfield and Nexus rise together, the benchmark is likely to benefit significantly.
If those three decline, gains among the smaller constituents may not be large enough to offset their effect.
Investors should therefore distinguish between number of constituents and effective diversification.
Six holdings do not automatically create a broadly diversified property portfolio.
Office Property Dominates the Market
Another concentration issue comes from property type.
Most of India’s largest REITs are heavily exposed to commercial offices.
Embassy, Brookfield India and Mindspace primarily own large office portfolios.
Knowledge Realty and Bagmane also increase the benchmark’s exposure to office property.
Nexus Select provides an important difference because its portfolio is focused mainly on retail centres and consumption-related assets.
This means the benchmark can be diversified across individual REITs while remaining strongly influenced by the office-property cycle.
Office REIT performance depends on factors including:
- Corporate hiring;
- Global Capability Centre expansion;
- Leasing demand;
- Rental growth;
- Occupancy;
- New property supply; and
- Financing costs.
A broad listed-property market would ideally provide greater exposure to logistics, industrial, hospitality, healthcare, residential rental and other property sectors as the Indian REIT universe develops.
Context is everything. Stay ahead of shifting trends with today’s market updates, and uncover emerging opportunities using the Serrari Group Market Index and Marketplace. Then, take control of your own financial future by exploring our Money & Life Reset Transformation Blueprint ™ to build stronger habits, create better systems, and design a path toward lasting wealth.
Interest Rates Matter to REIT Valuations
REITs are often sensitive to interest rates.
They generally own large property portfolios financed partly through debt.
When borrowing costs rise, refinancing becomes more expensive and can reduce the cash available for distributions.
Higher government-bond and fixed-deposit rates can also affect investor demand.
If investors can earn attractive income from lower-risk fixed-income products, they may require higher returns from REITs.
That can place pressure on REIT unit prices.
Falling rates can have the opposite effect.
Lower financing costs may support REIT cash flow while lower bond yields can make property distributions relatively more attractive.
However, interest rates are only one factor.
Occupancy, rental growth, asset acquisitions, property valuations and debt levels can be equally important.
The 5.75% Yield Needs Context
A 5.75% index dividend yield can appear attractive compared with an investment that produces no regular income.
However, yield alone does not determine whether a REIT investment is attractive.
A high yield can result from strong property cash flows.
It can also rise because the REIT’s unit price has fallen.
Investors therefore need to examine:
- Distribution growth;
- Occupancy;
- Rental escalation;
- Net operating income;
- Debt;
- Interest costs;
- Lease expiries;
- Asset quality; and
- Capital expenditure.
The yield should also be compared with prevailing government-bond, fixed-deposit and other income-producing investment rates.
The appropriate comparison depends on risk, liquidity and investment horizon rather than headline yield alone.
Historical Return Predates the Launch
The 18.54% one-year figure requires an important qualification.
The index launched on 7 August 2026.
Its earlier performance was calculated historically using the index methodology and a first value date of 19 September 2022.
Investors therefore did not actually hold the newly launched benchmark throughout that historical period.
The back-calculated numbers show how the index would have performed using its methodology.
They do not represent a live investment product’s realised return.
Historical index calculations can still be useful for comparing strategies, but they should not be confused with an actual fund track record.
Any ETF or index fund created from the benchmark would also incur expenses and tracking differences that the headline index return does not capture.
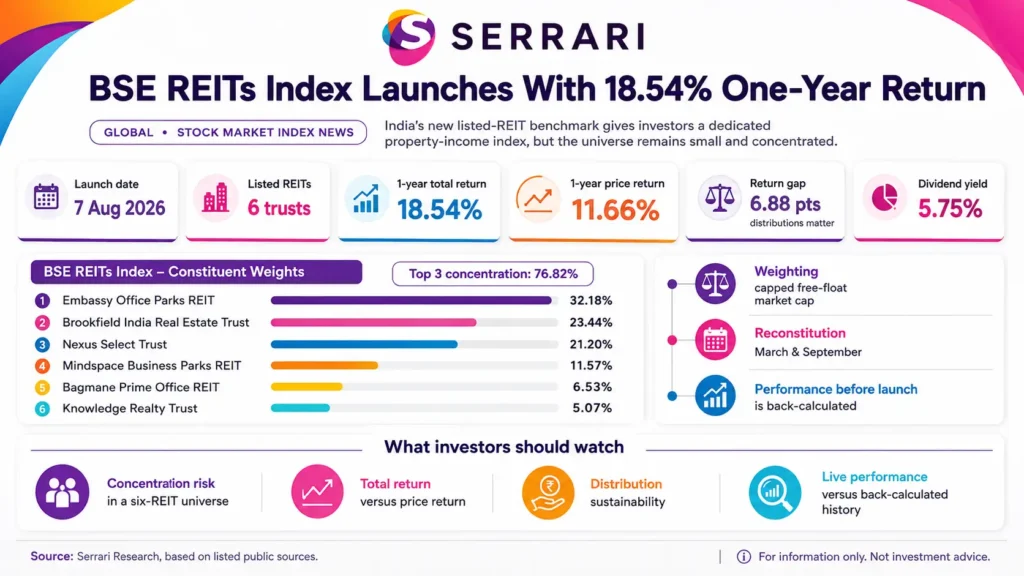
The BSE REITs Index launched with six Indian real-estate investment trusts and a back-calculated one-year total return of 18.54% as of 31 July 2026. Its one-year price return was 11.66%, illustrating the importance of distributions when measuring listed-property returns, while its reported dividend yield was 5.75%. Embassy Office Parks REIT carries the largest weight at 32.18%, followed by Brookfield India at 23.44% and Nexus Select at 21.20%. Together, the top three account for approximately 76.82% of the index, leaving only 23.18% for Mindspace, Bagmane Prime and Knowledge Realty. The infographic explains that the new benchmark improves REIT performance measurement but remains concentrated because India’s listed-REIT market is still relatively small.
Semi-Annual Rebalancing Can Change Exposure
The index is scheduled for semi-annual reconstitution in March and September.
This means the benchmark will periodically review its constituents and weights.
A new listed REIT could eventually become eligible.
An existing constituent’s allocation may rise or fall as market capitalisation and free float change.
The capped weighting methodology is intended to prevent unlimited concentration in one security while still allowing larger REITs to have greater influence.
Rebalancing matters because passive products linked to the benchmark would need to adjust their portfolios when the index changes.
That can create trading activity around rebalancing dates.
It also means today’s six holdings and weights should not be treated as permanent.
Valuation Multiples Need Careful Interpretation
At launch, the benchmark showed a price-to-book ratio of approximately 1.78 times and a reported price-to-earnings ratio of 68.55 times.
Investors should be careful when applying ordinary equity valuation ratios to REITs.
Accounting profit can be affected by property depreciation, valuation movements, interest expenses and other non-cash items.
REIT analysts therefore often consider additional measures such as:
- Net asset value;
- Net operating income;
- Funds from operations;
- Adjusted funds from operations;
- Distribution per unit;
- Loan-to-value ratios; and
- Occupancy.
A high accounting P/E does not automatically mean a REIT is more expensive than an ordinary company with the same multiple.
The underlying property economics and cash distributions need to be examined.
The Index Could Support Passive Products
One reason index providers create specialised benchmarks is to support financial products.
A fund manager can potentially launch:
- An ETF;
- An index mutual fund;
- A structured product;
- A portfolio benchmark; or
- Another passive strategy
that seeks to track the index.
This can expand access to the asset class.
Instead of purchasing six REITs separately and continually adjusting their weights, an investor could eventually use one fund that performs the portfolio construction automatically.
The benchmark also provides managers with a clearer performance reference.
A REIT-focused active fund could be compared with the REIT index rather than with a general stock-market or property-development benchmark.
Passive Property Investing Is Already Expanding
The timing is particularly relevant because Indian fund managers are beginning to develop more REIT-oriented passive products.
Edelweiss Mutual Fund opened its Nifty REITs & Realty Index Fund for subscription on 5 August.
The Edelweiss REIT-oriented fund launch report explains that the product tracks the Nifty REITs & Realty Total Return Index and currently combines REITs with real-estate companies.
That structure is different from the newly launched BSE REITs Index.
The BSE benchmark is designed specifically around listed REITs.
The two developments occurring during the same period suggest that India’s listed-property market is becoming large enough to support more specialised index and fund products.
Do Not Confuse the Two BSE Property Indexes
BSE now has more than one property-related benchmark.
The new BSE REITs Index launched on 7 August and consists exclusively of listed REITs.
The earlier BSE commercial real-estate index launch took place in July and created the BSE REITs and Commercial Real Estate Index.
That earlier benchmark combines REITs with listed companies that have significant commercial real-estate exposure.
The distinction is important.
A portfolio containing REITs only measures the listed trust structure.
A benchmark mixing REITs and property companies includes different business models, capital structures and earnings sources.
Investors comparing performance should confirm which benchmark they are actually looking at.
The Benchmark Makes Manager Comparison Easier
Before a dedicated benchmark exists, measuring the performance of a specialised asset class can be difficult.
A REIT portfolio might be compared with the Sensex, a real-estate developer index or a general property benchmark.
None provides an exact comparison.
The new index creates a more relevant reference point.
For example, if a manager running a portfolio of Indian REITs produces a total return of 14% while the BSE REITs Index produces 18%, investors can investigate why.
Possible explanations might include:
- Different constituent weights;
- Cash holdings;
- Fees;
- Active security selection;
- Timing of investments; or
- Distribution treatment.
A dedicated benchmark therefore improves performance measurement even for investors who never purchase an index fund.
Total Return Should Be the Main Comparison
When comparing REIT funds and managers, investors should generally pay close attention to total-return benchmarks.
A price-only index can be useful for showing changes in unit values.
However, it omits a major feature of the REIT investment model: cash distributions.
Comparing a distribution-paying REIT portfolio with a price-only benchmark can therefore distort performance.
The 18.54% versus 11.66% historical comparison demonstrates the size of that effect over the latest one-year period.
For long-term investors who reinvest income, the difference becomes particularly important because distributions can themselves generate additional future returns.
What Investors Should Monitor
The first issue is concentration.
The top three REITs currently account for nearly 77% of the benchmark.
Investors should monitor whether new listings gradually reduce that dependence.
They should also watch:
- Distribution growth;
- Rental increases;
- Portfolio occupancy;
- Office leasing;
- Retail consumption;
- Interest rates;
- REIT borrowing costs;
- Loan-to-value ratios;
- Net asset values;
- New property acquisitions;
- Sponsor transactions; and
- New REIT listings.
Investors should also compare the Total Return Index with the Price Return Index.
A widening difference would show distributions continuing to play a large role in investment performance.
A narrowing gap could result from stronger capital appreciation, lower distributions or different market conditions.
India’s REIT Regulations Continue to Evolve
India’s REIT market remains regulated by the Securities and Exchange Board of India.
The current SEBI REIT regulations framework was most recently amended on 18 April 2026.
Regulation matters because REIT structures rely on rules governing assets, disclosures, valuation, borrowing, governance and distributions.
A clearer regulatory framework can support institutional participation and investor confidence.
However, regulation cannot protect investors from ordinary market losses.
REIT unit values can still decline because of property conditions, leverage, interest rates or changes in investor sentiment.
Conclusion
The launch of the BSE REITs Index marks another step in the development of India’s listed-property market.
The benchmark creates a dedicated reference for six exchange-listed REITs and separates their performance from conventional property developers.
Its back-calculated numbers also provide a useful investor lesson.
The one-year Total Return Index return of 18.54% was substantially higher than the 11.66% price return, demonstrating the importance of distributions when assessing income-generating property investments.
However, the benchmark also exposes the limitations of India’s current REIT universe.
Embassy, Brookfield India and Nexus Select together represent approximately 76.82% of the index.
The new benchmark therefore improves diversification compared with owning a single REIT, but it does not yet provide the breadth available in larger global REIT markets.
As additional trusts list and passive products expand, the index may become more diversified.
For now, investors should pay equal attention to two features: income and concentration.
FAQs
1. What is the BSE REITs Index?
The BSE REITs Index is a new benchmark created by BSE Index Services to measure the performance of listed Indian real-estate investment trusts. It currently contains six REITs and uses capped free-float-adjusted market-capitalisation weighting. The benchmark gives investors a way to measure REIT performance separately from conventional property-development companies.
2. Why was the total return 18.54% when the price return was only 11.66%?
A price-return index measures changes in the market value of the REIT units. A total-return index also assumes distributions are reinvested. Because income distributions are an important part of REIT investing, including them can materially increase measured returns. The 6.88-percentage-point difference should not be interpreted simply as the dividend yield because distribution timing, reinvestment and index changes also affect the calculation.
3. Is the BSE REITs Index diversified?
It provides more diversification than owning one individual REIT, but concentration remains high. Embassy Office Parks represents 32.18%, Brookfield India 23.44% and Nexus Select 21.20%. Together, these three trusts account for approximately 76.82% of the benchmark. India’s listed REIT universe will need to expand further before the index can become significantly broader.
4. Can investors buy the BSE REITs Index directly?
An index itself is a benchmark rather than an investment security. Investors cannot normally buy the index directly. A fund manager could create an ETF, index fund or another product designed to track it. Investors can also purchase the underlying REIT units individually. Any future passive fund would have its own fees, tracking difference, liquidity and tax considerations.
Sources: Economic Times current index launch report, BSE Index Services official platform, SEBI current REIT regulations framework, SEBI investor guide to REITs, Economic Times passive-fund launch report , BSE commercial real-estate index launch.
Your financial future isn’t something you wait for—it’s something you build.
The real question is: when do you begin?
Move beyond simply staying informed.
Navigate the markets with clarity—track trends through the Serrari Group Market Index, uncover opportunities in the Serrari Marketplace, and build practical knowledge with our Curated Wealth Builder Platform.
Stay connected to what truly matters.
Get daily insights on macro trends and financial movements across Kenya, Africa, and global markets—delivered through the Serrari Newsletter.
Growth opens doors.
Advance your career through professional programs including ACCA, HESI A2, ATI TEAS 7 , HESI EXIT , NCLEX – RN and NCLEX – PN, Financial Literacy!🌟—designed to move you forward with confidence.
See where money is flowing—clearly and in real time.
Track Money Market Funds, Treasury Bills, Treasury Bonds, Green Bonds, and Fixed Deposits, alongside global and African indexes, key economic indicators, and the evolving Crypto and stablecoin landscape—all within Serrari’s Market Index