



AIG Q2 results show why an insurance company cannot be judged using net profit alone.
General Insurance underwriting income increased by approximately 10% to $686 million during the second quarter of 2026, while the combined ratio improved to 89.0%. Net premiums written also rose by 9%.
However, net income attributable to common shareholders declined to approximately $948 million as investment-related income weakened.
The difference reflects the two main engines of an insurer. Underwriting measures whether premiums are sufficient to cover claims and operating expenses, while investment income comes from investing the premiums and capital held by the insurer.
A combined ratio below 100% generally indicates an underwriting profit before investment income. AIG’s 89.0% ratio therefore shows strong core insurance economics despite weaker headline earnings.
Key Overview
- General Insurance net premiums written increased by 9% to approximately $7.52 billion.
- Underwriting income rose by about 10% to $686 million.
- The combined ratio improved to 89.0%.
- The adjusted accident-year combined ratio was 88.1%.
- Catastrophe charges reached approximately $210 million.
- Net income attributable to common shareholders fell to about $948 million.
- GAAP diluted earnings per share declined by 10% to $1.78.
- Adjusted diluted earnings per share increased by 10% to $2.00.
- Net investment income declined to approximately $1.13 billion.
- Adjusted pre-tax income reached approximately $1.40 billion.
- AIG returned $904 million to shareholders.
- Share repurchases totalled $641 million.
- Common dividends totalled approximately $263 million.
- The quarterly dividend remained $0.50 per share.
AIG Q2 Results Show Strong Underwriting Despite Profit Drop
American International Group delivered stronger underlying insurance results during the second quarter of 2026 even though its reported net income declined from the previous year.
According to Insurance Journal’s current underwriting analysis, AIG’s General Insurance underwriting income increased by nearly 10% to $686 million.
The segment’s combined ratio improved to 89.0% from 89.3% during the corresponding quarter of 2025.
At the same time, net income attributable to AIG shareholders declined to approximately $948 million from around $1.1 billion a year earlier.
The apparently conflicting results provide a useful lesson for insurance investors.
An insurer can improve the profitability of its actual insurance business while reporting lower overall net income because investment gains, investment income and other accounting items move in a different direction.
Insurance Companies Have Two Profit Engines
An insurance company can generate earnings from two major sources.
The first is underwriting.
Customers pay premiums to transfer particular risks to the insurer. The insurer then pays valid claims, commissions, administrative expenses and other costs associated with providing the cover.
If premiums exceed the claims and expenses associated with those policies, the insurer generates an underwriting profit.
The second engine is investment income.
Insurance companies receive premiums before many claims are eventually paid.
During that period, the money can be invested in assets such as:
- Government bonds;
- Corporate bonds;
- Mortgage securities;
- Equities;
- Cash instruments; and
- Alternative investments.
The returns generated by this investment portfolio provide an additional source of earnings.
A quarter can therefore contain strong underwriting but weaker investment performance—or the reverse.
AIG’s second-quarter results provide a clear example of the first situation.
The Combined Ratio Explains Underwriting
The combined ratio is one of the most important numbers when analysing a property and casualty insurer.
In simple terms, it compares claims and underwriting expenses with premium income.
A combined ratio below 100% generally indicates that the insurer generated an underwriting profit before considering investment income.
A ratio above 100% generally indicates that claims and operating expenses exceeded the premiums earned from the insurance business.
AIG reported a General Insurance combined ratio of 89.0%.
The official AIG investor reporting archive provides the company’s quarterly reporting materials and financial supplements used to assess these underwriting measures.
At 89%, AIG was spending roughly 89 cents on claims and underwriting-related costs for each dollar of premium measured under the ratio, leaving an underwriting margin before investment income.
The lower the combined ratio, all else being equal, the stronger the underwriting profitability.
A 89% Ratio Is Not a Net Profit Margin
The 11-percentage-point difference between 89% and 100% should not be described as AIG’s overall profit margin.
The combined ratio excludes several items that affect final shareholder earnings.
These can include:
- Investment income;
- Corporate expenses;
- Interest costs;
- Taxes;
- Realised investment gains and losses;
- Equity-market movements; and
- Other non-underwriting items.
It is therefore best understood as an indicator of insurance operating efficiency rather than the company’s complete profitability.
This distinction explains how AIG could post a strong 89% combined ratio while its reported net income still declined.
Premiums Continued to Grow
General Insurance net premiums written increased by approximately 9% to $7.52 billion.
Premium growth is useful because it can expand the amount of business over which AIG earns underwriting profits.
However, higher premium volume is valuable only when the underlying policies are priced adequately for the risks being insured.
An insurer could increase premiums rapidly by lowering prices or accepting weaker risks, only to suffer larger claims later.
AIG’s higher premium volume occurred alongside an improvement in its combined ratio.
That combination is more encouraging because it suggests that the company was growing while maintaining underwriting discipline rather than sacrificing profitability simply to increase market share.
The AIG official investor relations page identifies underwriting discipline as a central part of the group’s insurance strategy and provides access to its current earnings materials.
Underwriting Income Reached $686 Million
AIG generated $686 million in General Insurance underwriting income during the quarter, approximately 10% more than a year earlier.
The improvement came despite catastrophe losses of around $210 million, compared with $170 million during the previous year’s quarter.
According to Insurance Journal’s General Insurance breakdown, approximately $75 million of the quarter’s catastrophe losses related to the conflict in the Middle East.
AIG also recorded favourable prior-year development of $145 million, compared with $112 million a year earlier.
Prior-year development occurs when the ultimate cost of claims from earlier periods develops differently from what the insurer originally estimated.
Favourable development means earlier claim reserves ultimately appear more than sufficient, allowing part of the reserve to benefit current results.
Accident-Year Results Give Another View
AIG also reported an adjusted accident-year combined ratio of approximately 88.1%.
The accident-year measure tries to provide investors with a clearer view of claims arising from the current underwriting year by adjusting for certain developments relating to earlier periods.
This distinction matters because an insurer could post a strong headline combined ratio partly because claims from previous years turned out better than expected.
Investors therefore often examine both:
- The reported combined ratio; and
- The current accident-year ratio.
If both are improving, the evidence of stronger underlying underwriting can be more convincing.
AIG’s reported 89.0% combined ratio and adjusted accident-year ratio of 88.1% both point toward profitable insurance operations during the quarter.
North America Commercial Improved
AIG’s North America Commercial business recorded underwriting income of approximately $372 million, compared with $301 million during the previous year.
Net premiums written increased by 9% to about $3.1 billion.
Its combined ratio improved to 84.0% from 85.9%.
That means the North American commercial business was one of the strongest contributors to AIG’s overall underwriting performance.
Commercial insurance can include coverage for areas such as:
- Property;
- Casualty;
- Financial lines;
- Cyber risk;
- Marine;
- Energy; and
- Other corporate exposures.
An 84% combined ratio indicates strong underwriting profitability, although investors should not assume that such a level will be maintained every quarter.
Commercial insurance pricing can change as competition increases and more insurers become willing to accept risk.
Global Personal Also Strengthened
AIG’s Global Personal business also showed meaningful improvement.
Underwriting income increased to approximately $114 million from around $25 million during the previous year’s quarter.
Net premiums written increased by 7%.
The combined ratio improved from 98.5% to approximately 92.9%.
This means the business moved from being close to underwriting break-even toward a more comfortable underwriting profit.
The improvement provided another source of support for overall General Insurance results.
However, the strength was not uniform across every business line.
International Commercial Was Weaker
International Commercial underwriting income fell to approximately $200 million, down around 33% from the previous year.
This is important because consolidated figures can hide major differences between business units.
AIG’s overall underwriting income increased even though one significant part of the portfolio weakened.
The current AIG segment performance analysis shows why investors need to look below the consolidated combined ratio.
A strong overall number can reflect exceptional performance in some divisions offsetting pressure elsewhere.
If weakness spreads across more segments in future quarters, maintaining the current underwriting performance could become more difficult.
Context is everything. Stay ahead of shifting trends with today’s market updates, and uncover emerging opportunities using the Serrari Group Market Index and Marketplace. Then, take control of your own financial future by exploring our Money & Life Reset Transformation Blueprint ™ to build stronger habits, create better systems, and design a path toward lasting wealth.
Investment Income Moved the Other Way
While underwriting improved, investment-related earnings provided less support to AIG’s bottom line.
Net investment income was approximately $1.13 billion during the quarter.
This helps explain why reported net income could decline even as General Insurance operations strengthened.
Insurance companies typically hold large investment portfolios because premiums are received before many claims are paid.
Returns on these assets can materially influence shareholder earnings.
Changes in:
- Bond yields;
- Equity markets;
- Credit spreads;
- Alternative investments; and
- Realised gains or losses
can therefore cause investment earnings to fluctuate independently of the insurance business.
The AIG official quarterly reporting centre allows investors to separate insurance operating performance from movements associated with the broader investment portfolio.
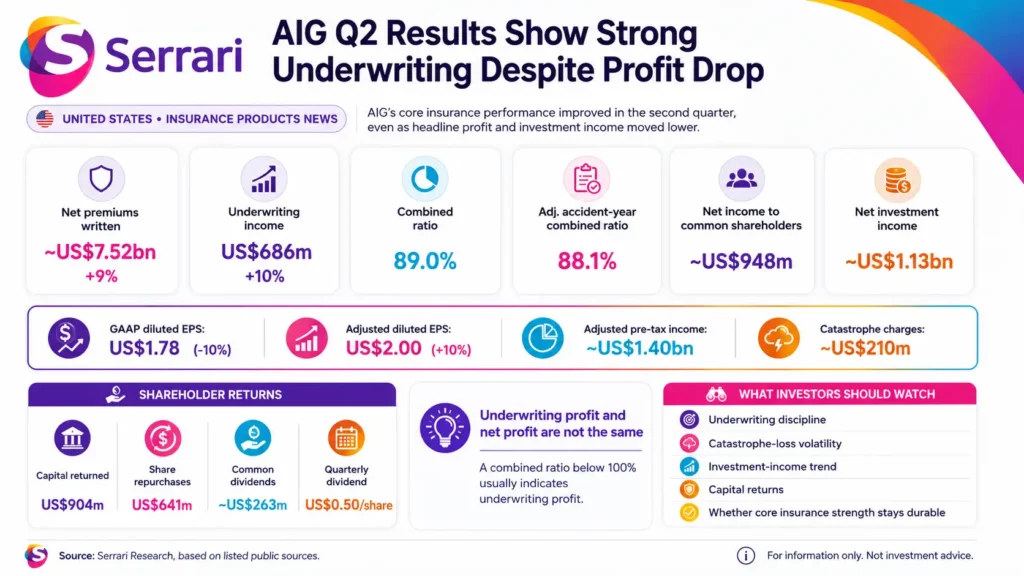
AIG’s second-quarter 2026 results show how an insurance company’s operating performance can improve even when headline net income declines. General Insurance net premiums written increased by 9% to approximately $7.52 billion, underwriting income rose by 10% to $686 million and the combined ratio improved to 89.0%. An insurer generally produces an underwriting profit when its combined ratio is below 100%. However, AIG’s net income attributable to common shareholders declined to approximately $948 million as investment-related earnings weakened. The infographic shows the insurer’s two profit engines: underwriting, which measures premiums against claims and operating expenses, and investment income, which represents returns generated from invested insurance funds.
GAAP Earnings Declined
AIG reported GAAP diluted earnings per share of approximately $1.78, around 10% lower than the previous year.
However, adjusted diluted earnings per share increased by approximately 10% to $2.00.
These two figures should not be mixed.
GAAP earnings include the accounting items required under US financial-reporting rules.
Adjusted earnings remove selected items that management considers less useful for assessing the underlying operating business.
The AIG SEC filings information page gives investors access to the company’s regulatory filings and the reconciliations needed to understand the difference between reported and adjusted performance.
Adjusted earnings can help explain underlying trends, but they should not replace GAAP results.
Investors should understand what has been excluded before relying on any non-GAAP measure.
Core Operating ROE Was Higher
AIG reported return on equity of approximately 9.4%.
Core Operating ROE was higher at about 11.1%.
Return on equity measures earnings relative to shareholder capital.
A higher ROE can indicate that a company is generating more earnings from each dollar of shareholder equity.
However, Core Operating ROE is an adjusted measure.
It removes certain items that AIG does not consider representative of its continuing underlying business.
As with adjusted EPS, it can be useful for analysing trends but should be reviewed alongside the company’s GAAP return.
Corebridge Complicated the Comparison
AIG’s relationship with Corebridge Financial also affected reported earnings comparisons.
The insurer completed the sale of its remaining Corebridge position, continuing a multi-year process of separating the life and retirement business from AIG.
Insurance Journal reported that AIG sold its remaining 25 million Corebridge shares for a gain of approximately $710 million.
Changes associated with the Corebridge investment and other equity securities contributed to differences between the current and prior-year GAAP results.
The Insurance Journal AIG earnings analysis therefore reinforces why shareholders should separate movements in investments and divestitures from the performance of AIG’s core insurance portfolio.
Capital Returns Remained Strong
AIG continued returning capital to shareholders during the quarter.
The company returned approximately $904 million through dividends and share repurchases.
Share buybacks accounted for about $641 million, while common dividends represented approximately $263 million.
AIG’s quarterly dividend stands at $0.50 per common share following the 11% increase approved earlier in 2026.
The official AIG first-quarter dividend announcement confirmed the increase from $0.45 to $0.50 per share, marking another year of higher shareholder distributions.
Share repurchases can also increase earnings per share over time if the company reduces the number of shares outstanding while maintaining earnings.
However, buybacks create value only when the shares are purchased at sensible valuations and the company retains sufficient capital for insurance claims and future growth.
Insurance Capital Must Come Before Dividends
Insurers cannot distribute all their available cash to shareholders.
They need substantial capital to cover unexpected claims, catastrophes and adverse changes in their investment portfolios.
Regulators also require insurance subsidiaries to maintain minimum capital levels.
AIG must therefore balance:
- Dividends;
- Share repurchases;
- Insurance growth;
- Investment opportunities;
- Debt management; and
- Capital needed against insured risks.
Strong underwriting can increase the amount of capital generated internally.
However, a major catastrophe or unexpected claims development can change capital requirements rapidly.
Shareholder distributions should therefore be assessed alongside the strength of the insurer’s balance sheet rather than in isolation.
Catastrophe Risk Can Change Quickly
Catastrophe losses reached approximately $210 million during the quarter.
These losses can vary substantially between reporting periods depending on hurricanes, wildfires, floods, earthquakes, political violence and other large events.
An insurer may produce an excellent combined ratio during a quiet catastrophe quarter and a materially weaker one several months later.
This makes one-quarter results less reliable when considered alone.
Investors should examine underwriting performance across several years and different catastrophe environments.
AIG generated a full-year combined ratio of 90.1% in 2025 and underwriting income of $2.3 billion, demonstrating that the current quarter follows a broader period of strong underwriting performance.
Reinsurance Helps Manage Catastrophe Exposure
Large insurers use reinsurance to transfer some of the risks they underwrite to other insurance companies.
This can protect the balance sheet from unusually large claims.
For example, AIG may insure a commercial property but transfer part of the potential loss to a reinsurer.
The arrangement reduces the amount AIG could lose from a major event but also requires the company to pay part of the premium economics to the reinsurer.
Reinsurance therefore involves a trade-off between:
- Risk reduction;
- Capital protection;
- Premium retention; and
- Cost.
Changes in global reinsurance pricing can affect the profitability of AIG’s insurance products even where customer premiums remain unchanged.
Pricing Conditions Are Becoming More Selective
Insurance markets move through pricing cycles.
After major losses or periods of limited insurance capacity, premiums may increase because customers are competing for available cover.
This is often described as a hard insurance market.
As more capital enters the sector and competition increases, premium increases can slow or prices can begin declining.
AIG management has described the current market as moving away from broad positive pricing toward a more selective environment.
The current industry assessment of AIG noted that profitability and growth are becoming increasingly dependent on individual insurance lines rather than a broad rise in prices across the whole market.
This makes underwriting discipline increasingly important.
Premium Growth Alone Is Not Enough
Investors should be cautious when insurers highlight strong premium growth.
More premiums can increase earnings only if the insurer has correctly priced the risks being accepted.
Poorly priced insurance may look profitable initially because premiums are collected before claims fully emerge.
Losses may appear years later, particularly in liability and casualty products where claims can take a long time to settle.
The strongest insurance growth therefore combines:
- Higher premium volume;
- Disciplined pricing;
- Controlled claims;
- Adequate reserves; and
- Attractive returns on capital.
AIG’s 9% premium growth alongside a sub-90% combined ratio suggests favourable current economics, but future claims development remains important.
What Investors Should Monitor
The first figure to monitor is the combined ratio.
A sustained ratio below 100% would indicate continued underwriting profitability.
Investors should also track the adjusted accident-year combined ratio to determine whether current business remains profitable without relying heavily on reserve releases from earlier periods.
Other important indicators include:
- Net premiums written;
- Catastrophe losses;
- Prior-year reserve development;
- Commercial insurance pricing;
- Net investment income;
- Bond-market yields;
- Adjusted and GAAP earnings;
- Return on equity;
- Capital returned to shareholders; and
- Share-repurchase activity.
Investors should also monitor individual business lines.
North America Commercial and Global Personal improved significantly during the quarter, while International Commercial weakened.
AIG’s official financial reporting and statements will show whether that divergence persists in future quarters.
Conclusion
AIG’s second-quarter results demonstrate why net income alone can provide an incomplete picture of an insurance company’s performance.
Reported net income attributable to common shareholders declined to approximately $948 million.
However, the underlying General Insurance business strengthened.
Net premiums written increased by 9%, underwriting income rose by approximately 10% to $686 million and the combined ratio improved to 89.0%.
These figures indicate that AIG was earning a meaningful underwriting profit before investment income.
The weaker headline earnings reflected movements outside the core insurance engine, including investment-related effects and the company’s remaining Corebridge exposure.
For investors, neither number should be ignored.
Strong underwriting determines whether AIG is pricing and managing insurance risk effectively.
Investment returns determine how much additional income the company’s large pool of invested assets produces.
AIG’s quarter therefore shows that the health of an insurance company is best assessed by examining both engines together.
The strongest current signal is the underwriting business.
The main question for future quarters is whether AIG can maintain a sub-90% combined ratio as insurance pricing becomes more competitive and catastrophe losses continue to fluctuate.
FAQs
1. What does AIG’s 89% combined ratio mean?
The combined ratio compares insurance claims and underwriting expenses with premium income. A ratio below 100% generally indicates an underwriting profit before investment income. AIG’s 89.0% General Insurance combined ratio therefore suggests that its premiums comfortably exceeded the claims and underwriting expenses measured by the ratio during the quarter. It should not be interpreted as an 11% overall net profit margin.
2. Why did AIG’s net income fall if underwriting improved?
Insurance companies earn money from underwriting and from investing the assets they hold. AIG’s underwriting business improved, but investment-related earnings and other accounting movements were weaker. The company also had year-on-year movements associated with its Corebridge Financial investment and equity securities. These factors allowed General Insurance operations to strengthen while consolidated GAAP net income declined.
3. What is the difference between GAAP and adjusted AIG earnings?
GAAP earnings include all items required under US accounting standards. AIG’s adjusted earnings remove selected items that management believes make it more difficult to compare the underlying operating business between periods. In Q2 2026, GAAP diluted EPS declined by approximately 10% to $1.78 while adjusted diluted EPS increased by about 10% to $2.00. Investors should review both measures and understand the excluded items rather than relying on adjusted earnings alone.
4. Why does investment income matter so much to insurers?
Insurers collect premiums before many claims are eventually paid. They invest much of this money in bonds and other assets during the period between receiving premiums and paying claims. The income produced by those investments can be a major contributor to overall earnings. Changes in interest rates, bond yields, equity markets and other investments can therefore move insurer profits even when the underlying insurance business is performing well.
Sources: AIG official investor reporting archive, AIG official investor relations page, AIG current SEC filings page, Insurance Journal current underwriting analysis, AIG quarterly presentations and webcasts, Morningstar syndicated dividend announcement.
Your financial future isn’t something you wait for—it’s something you build.
The real question is: when do you begin?
Move beyond simply staying informed.
Navigate the markets with clarity—track trends through the Serrari Group Market Index, uncover opportunities in the Serrari Marketplace, and build practical knowledge with our Curated Wealth Builder Platform.
Stay connected to what truly matters.
Get daily insights on macro trends and financial movements across Kenya, Africa, and global markets—delivered through the Serrari Newsletter.
Growth opens doors.
Advance your career through professional programs including ACCA, HESI A2, ATI TEAS 7 , HESI EXIT , NCLEX – RN and NCLEX – PN, Financial Literacy!🌟—designed to move you forward with confidence.
See where money is flowing—clearly and in real time.
Track Money Market Funds, Treasury Bills, Treasury Bonds, Green Bonds, and Fixed Deposits, alongside global and African indexes, key economic indicators, and the evolving Crypto and stablecoin landscape—all within Serrari’s Market Index