





Solana (SOL) fell towards $70 on November 16, extending a seven-week decline as institutional withdrawals and weakness across the cryptocurrency market continued to weigh on its price. The cryptocurrency dropped to $67.41 over the weekend, its lowest level since late June, before recovering to around 72. US spot Solana ETFs recorded approximately $32.05 million in net outflows during the week ending November 13, marking their sixth consecutive week of withdrawals. Technical indicators, including a Relative Strength Index (RSI) near 20 and a negative MACD, point to sustained selling pressure, although oversold conditions could allow a short-term rebound.
Key Takeaways
- Solana fell towards $70 on November 16, after reaching a four-month low of $67.41.
- SOL has recorded seven consecutive lower weekly closes, falling 40.4% from its September 27 closing level.
- US spot Solana ETFs recorded approximately $32.05 million in net outflows during the week ending November 13.
- ETF withdrawals have reached approximately $197.4 million over six consecutive weeks.
- Solana’s daily RSI stood near 20, indicating deeply oversold conditions.
- The cryptocurrency remains below its 50-day, 100-day and 200-day exponential moving averages.
- Traders are monitoring $70, $68, $65 and $60 as potential downside levels, while $78.35 and $91.06 represent important resistance levels.
Why Is Solana Falling Towards $70?
Solana price has fallen toward $70 on November 16, extending its seven-week decline as continued ETF withdrawals and weakness across the cryptocurrency market keep pressure on SOL.
According to crypto.news market data, Solana traded at $70.80 on Monday, down 2.61% over 24 hours and 16.84% over the past seven days. The cryptocurrency has lost 31.87% over the past month after falling from its late-September levels above $120.
SOL dropped to $67.41 over the weekend, its lowest level since late June, before recovering above $70.
The decline has continued despite a brief recovery following the weekend selloff. Other reports placed SOL around 72 on Monday, showing that the cryptocurrency remained under pressure even after moving above its recent low.
The cryptocurrency continues to struggle as institutional demand weakens, with US spot Solana exchange-traded funds (ETFs) recording their sixth consecutive week of net outflows.
The latest decline reflects a combination of reduced institutional exposure, weakness across the wider cryptocurrency market and deteriorating technical indicators.
SOL has also recorded seven consecutive lower weekly closes. Sunday’s closing price of $72.71 was down 40.4% from the September 27 weekly close of $121.96.
This prolonged decline suggests that the recent weakness extends beyond a short-term market correction.
How Much Money Has Left Solana ETFs?
One of the major factors weighing on Solana is continued withdrawals from US-listed spot exchange-traded funds.
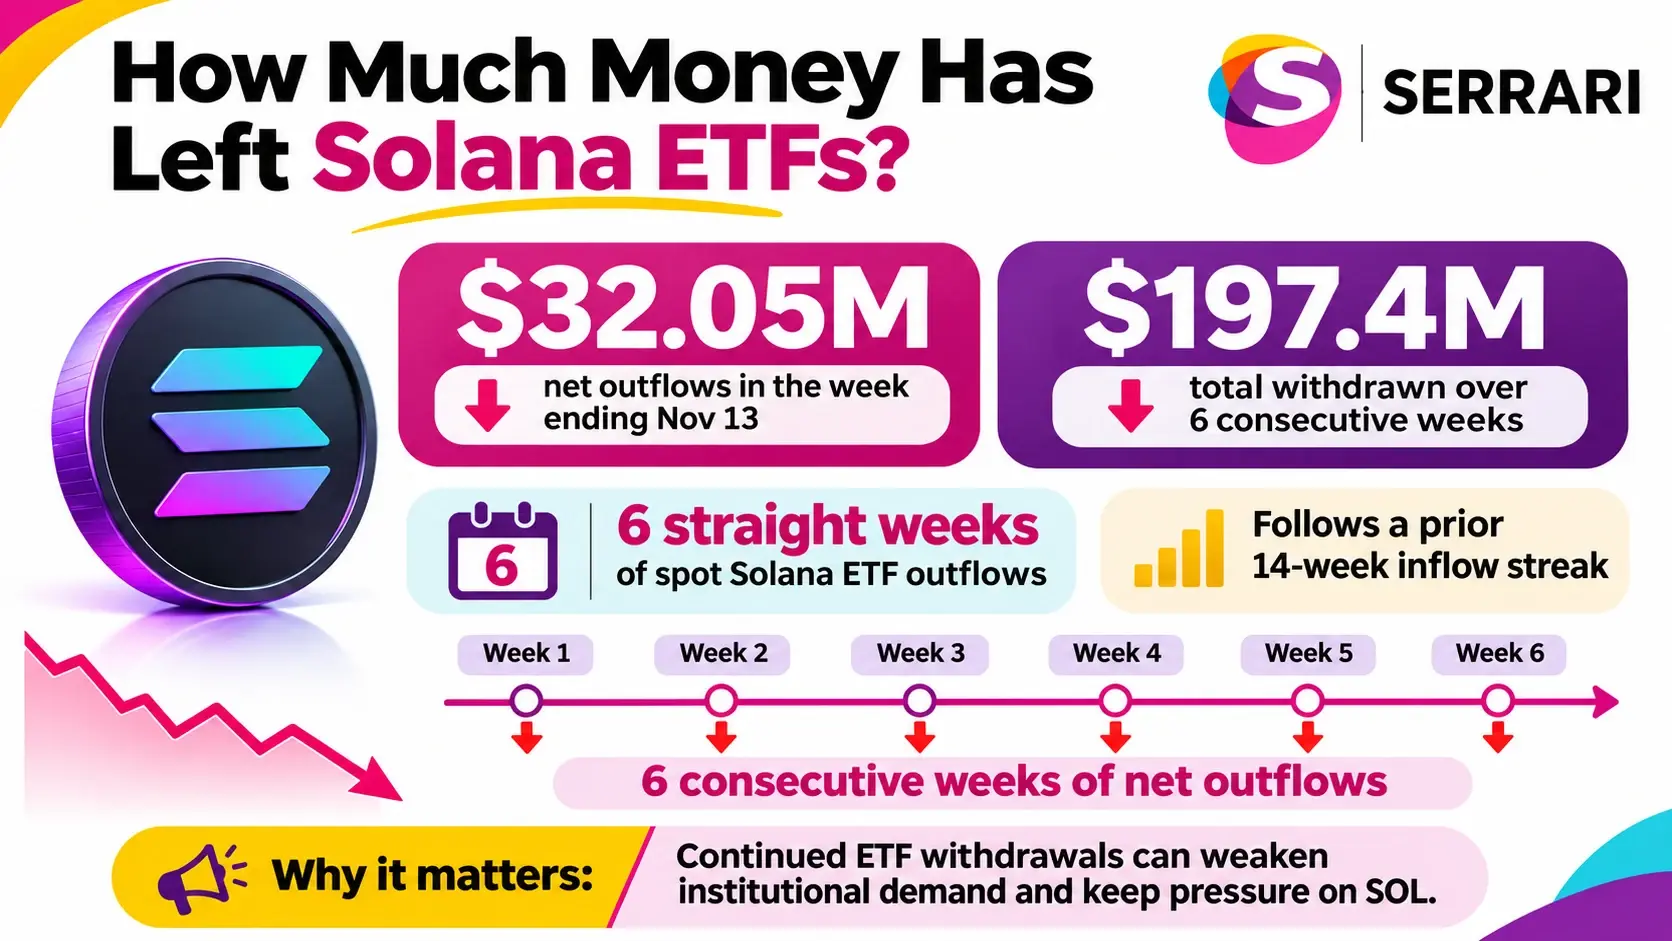
Data from Farside Investors showed that spot Solana ETFs recorded roughly $32.05 million in net outflows during the week ending November 13, extending their losing streak to six consecutive weeks.
The withdrawals have reached approximately $197.4 million over the six-week period, following a previous run of 14 consecutive weeks of net inflows.
The latest withdrawals were recorded across several trading sessions.
On November 10, the products lost around $13.4 million, followed by $5.9 million on November 11 and another $3.1 million on November 13.
Fidelity’s FSOL accounted for the November 13 withdrawals, while Bitwise’s BSOL recorded some of the largest redemptions during the preceding sessions.
The continued withdrawals indicate that investors have been reducing their exposure to Solana through regulated investment products.
ETF outflows matter because they reflect a reduction in capital held through these products and can weaken an important source of institutional demand.
If this outflow trend continues and intensifies this week, it could put additional pressure on SOL, pushing its price into a deeper correction.
A sustained return to positive ETF inflows would provide stronger evidence that institutional confidence is beginning to improve. Until then, Solana’s recovery could remain vulnerable to renewed selling.
How Is the Wider Cryptocurrency Market Affecting Solana?
Solana’s decline has taken place alongside losses across major cryptocurrencies, suggesting that the pressure is not limited to SOL.
Solana’s decline has followed losses across major cryptocurrencies, with Bitcoin trading near $64,000 and Ethereum around $1,800 on November 16.
According to CoinMarketCap, the Crypto Fear & Greed Index stood at 12, indicating extreme fear, while total cryptocurrency market capitalization declined 3.73% to approximately $2.18 trillion.
The Fear & Greed Index measures market sentiment by assessing factors associated with investor behaviour and market conditions. A reading of 12 indicates that fear is particularly high among cryptocurrency market participants.
The broader selloff has added to the pressure on Solana, with investors facing losses across several major digital assets.
However, SOL has fallen more heavily than Bitcoin and Ethereum over the past seven days, reflecting the continued weakness in its recent price performance.
The latest figures add to the selling pressure that had already pushed Solana below $100 in October.
As the cryptocurrency market remains under pressure, Solana’s ability to recover will depend partly on whether investor demand improves and whether the wider market stabilises.
What Do Solana’s Technical Indicators Say About Its Price?
Solana’s technical outlook remains bearish, with the cryptocurrency trading below several important moving averages and struggling to recover lost support levels.
Solana’s daily chart continues to show lower highs and lower lows, with the cryptocurrency struggling to recover after losing the $80 support level.
SOL remains below its 50-day, 100-day and 200-day exponential moving averages (EMAs), reported near $94.62, $95.80 and $96.14, respectively.
Moving averages calculate an asset’s average price over a specified period. Traders use them to assess market direction and identify potential support and resistance levels.
When an asset trades below its major moving averages, it can indicate that its price trend remains weak.
Solana has also fallen below a previously supportive ascending trendline, which now acts as resistance around $91.06.
The breakdown indicates that the cryptocurrency has lost an important technical structure that previously supported higher prices.
The combination of declining prices, lower highs and lower lows, and trading below major moving averages suggests that sellers continue to dominate the market.
Does Solana’s Oversold RSI Signal a Possible Rebound?
Despite the broader bearish trend, some technical indicators suggest that Solana’s recent decline may be becoming overstretched.
The Relative Strength Index stood near 19.80, below the conventional oversold threshold of 30.
The Relative Strength Index (RSI) measures the speed and magnitude of recent price movements. It is commonly used to assess whether an asset is overbought or oversold.
An RSI reading below 30 generally indicates that selling pressure has become excessive relative to recent price movements.
Solana’s reading near 20 therefore places it deep in oversold territory.
However, an oversold reading does not automatically mean that the price has reached its bottom. An asset can remain oversold while its price continues to decline.
The Moving Average Convergence Divergence (MACD) indicator also remains negative.
The Moving Average Convergence Divergence indicator remained negative at -7.82, below its signal line of -6.31. Its negative histogram reading of -1.51 suggests that bearish momentum has not yet reversed.
The combination of deeply oversold RSI conditions and negative MACD readings presents a mixed near-term outlook.
A temporary recovery is possible, but the wider technical structure remains bearish.
Technical analyst More Crypto Online also observed that SOL had reached its 78.6% Fibonacci retracement near $70, a level associated with the lower boundary of the current corrective structure.
“The upside reaction is not yet strong enough to confirm a low,” the analyst wrote.
The observation suggests that a recovery above $70 alone may not be sufficient to establish that the decline has ended.
Context is everything. Stay ahead of shifting trends with today’s market updates, and uncover emerging opportunities using the Serrari Group Market Index and Marketplace. Then, take control of your own financial future by exploring our Money & Life Reset Transformation Blueprint ™ to build stronger habits, create better systems, and design a path toward lasting wealth.
Which Solana Price Levels Are Traders Watching?
With SOL trading around $70, traders are monitoring several price levels that could influence its next move.
The immediate area to watch is $70, followed by support around $68 and $65.
A sustained move below those levels could expose the $60 region, while a recovery would first encounter resistance around $73 and $75.
The recent low of $67.41 is also important because it represents the lowest price recorded during the latest decline.
A sustained breakdown below this level could weaken the technical outlook further.
On the upside, Solana faces immediate resistance at $78.35.
A sustained move above this horizontal resistance would suggest that buyers are regaining some short-term control.
However, SOL would still need to overcome the former ascending trendline near $91.06. Reclaiming this level would represent a more meaningful technical improvement.
Beyond $91.06, Solana faces a resistance cluster formed by its major daily EMAs:
- 50-day EMA: approximately $94.62.
- 100-day EMA: approximately $95.80.
- 200-day EMA: approximately $96.14.
- Additional horizontal resistance: approximately $97.77.
A breakout above this zone could encourage buyers to target the higher resistance levels, although the cryptocurrency would need to regain momentum first.
Has Solana’s Alpenglow Upgrade Helped Its Price?
Solana’s price decline has continued despite the completion of its Alpenglow mainnet upgrade on October 21.
The upgrade introduced a new consensus system designed to reduce transaction finality times.
Transaction finality refers to the point at which a transaction is considered confirmed and irreversible on a blockchain.
Reducing transaction finality times is intended to improve the speed at which transactions are confirmed on the network.
However, the upgrade has not prevented the recent decline in SOL’s market price.
The difference highlights that developments in a blockchain’s technology do not necessarily translate into immediate gains in the market value of its cryptocurrency.
Solana’s price is also influenced by broader market sentiment, institutional demand, trading activity and investor expectations.
The recent ETF withdrawals and wider cryptocurrency selloff have continued to weigh on SOL despite the network upgrade.
The Bigger Picture
Solana’s decline towards $70 highlights the impact of institutional investment flows and broader market sentiment on cryptocurrency prices.
The six consecutive weeks of ETF outflows suggest that demand through regulated investment products has weakened, while the wider market selloff has increased pressure on major digital assets.
The technical indicators also point to a market struggling to establish a recovery. Although the RSI suggests oversold conditions, the negative MACD and price position below major moving averages indicate that bearish momentum remains in place.
The situation also highlights the difference between developments in blockchain technology and the market performance of a cryptocurrency. Solana’s Alpenglow upgrade introduced improvements to its network, but this has not prevented SOL from falling alongside the wider market.
Why Does This Matter Now?
Solana’s fall towards $70 is significant because it extends a seven-week decline and follows six consecutive weeks of withdrawals from US spot Solana ETFs.
For investors, the continued outflows raise questions about institutional demand, while the technical indicators point to further uncertainty around the cryptocurrency’s short-term direction.
The $67.41 weekend low, the $70 price level and the potential support zones around $68 and $65 will be important to monitor.
A recovery above $75 and then $78.35 could indicate an improvement in short-term momentum. However, a sustained move below $67.41 could expose SOL to further downside.
The next direction will also depend on whether ETF flows improve and whether the wider cryptocurrency market begins to stabilise.
Outlook
Solana remains under pressure as institutional withdrawals and the broader cryptocurrency selloff continue to weigh on its price.
Although the RSI reading near 20 indicates deeply oversold conditions, the negative MACD and position below major moving averages suggest that bearish momentum has not yet reversed.
The immediate levels to watch are $70, $68 and $65 on the downside, while $75 and $78.35 are important resistance levels for a potential recovery.
A sustained return to positive ETF inflows could provide stronger evidence that institutional demand is improving. Until then, Solana’s recovery remains vulnerable to renewed selling.
Frequently Asked Questions
1. Why is Solana falling towards $70?
Solana is under pressure due to continued withdrawals from US spot Solana ETFs, weakness across the wider cryptocurrency market and bearish technical indicators.
2. How much money has flowed out of Solana ETFs?
US spot Solana ETFs recorded approximately $32.05 million in net outflows during the week ending November 13. Total withdrawals reached approximately $197.4 million over six consecutive weeks.
3. Does Solana’s RSI reading near 20 mean its price will recover?
Not necessarily. An RSI reading below 30 indicates oversold conditions, but it does not confirm that the price has reached its bottom. Solana’s negative MACD suggests that bearish momentum remains in place.
4. What are the important Solana price levels to watch?
Traders are monitoring $70, $68 and $65 as potential downside levels, with $60 as a further level of interest. On the upside, $75 and $78.35 are important resistance levels, followed by $91.06.
Your financial future isn’t something you wait for—it’s something you build.
The real question is: when do you begin?
Move beyond simply staying informed.
Navigate the markets with clarity—track trends through the Serrari Group Market Index, uncover opportunities in the Serrari Marketplace, and build practical knowledge with our Curated Wealth Builder Platform.
Stay connected to what truly matters.
Get daily insights on macro trends and financial movements across Kenya, Africa, and global markets—delivered through the Serrari Newsletter.
Growth opens doors.
Advance your career through professional programs including ACCA, HESI A2, ATI TEAS 7 , HESI EXIT , NCLEX – RN and NCLEX – PN, Financial Literacy!🌟—designed to move you forward with confidence.
See where money is flowing—clearly and in real time.
Track Money Market Funds, Treasury Bills, Treasury Bonds, Green Bonds, and Fixed Deposits, alongside global and African indexes, key economic indicators, and the evolving Crypto and stablecoin landscape—all within Serrari’s Market Index.