



The Nasdaq-100 correction in 2026 is a test of whether US equity leadership has become too dependent on a small group of large technology companies. A 10% decline from a recent peak meets the conventional definition of a correction, but the investor question is deeper: whether the move is a temporary valuation reset, a repricing of long-duration growth assets, or the beginning of a rotation away from heavily weighted technology companies. Rising oil, persistent inflation and a less reassuring Federal Reserve message increase the pressure on growth stocks because higher discount rates reduce the present value of future earnings.
Key Overview
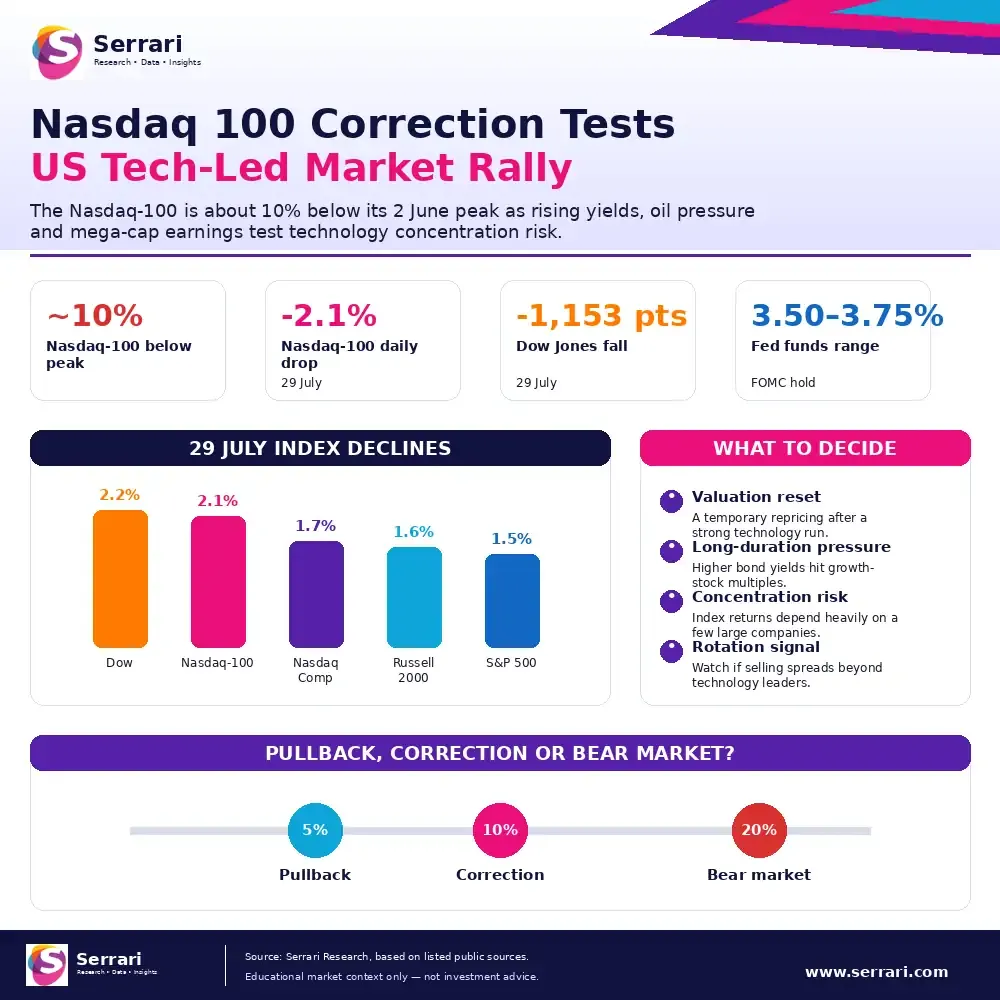
- Nasdaq-100: approximately 10% below its June 2 peak.
- Nasdaq-100 daily decline: about 2.1% on July 29.
- S&P 500: down 1.5% to 7,316.15.
- Dow: down 2.2%, or 1,153.18 points, to 51,594.14.
- Nasdaq Composite: down 1.7% to 24,442.94.
- Russell 2000: down 1.6% to 2,906.31.
- Federal funds target range: 3.50%–3.75%.
- The correction reflects technology valuation pressure, inflation concerns, oil risk and uncertainty over future interest-rate increases.
Nasdaq 100 Correction Tests US Tech-Led Market Rally
Why the Nasdaq-100 Matters More Than the Dow Point Drop
The Dow’s 1,153-point fall makes a strong headline, but the Nasdaq-100 correction matters more for portfolio risk. The Nasdaq-100 underpins technology-heavy ETFs, pension allocations, structured products and global growth portfolios. It is also more concentrated in large technology and communications companies than many investors realise.
Nasdaq’s official index page provides the benchmark history used by investors to track the Nasdaq-100’s moves over time. The correction therefore affects not only traders watching one US index, but also global investors with indirect exposure through funds and retirement products.
A Correction Is Not Yet a Bear Market
Barron’s / WSJ market coverage reported that the Nasdaq-100 entered correction territory after falling more than 10% from its June 2 record close. A correction is typically defined as a decline of 10% or more from a recent high, while a bear market generally begins at a 20% decline.
That distinction matters. A correction does not automatically mean the technology rally is over. It does mean investors are now demanding more evidence that earnings, margins and cash flow can justify valuations.
Context is everything. Stay ahead of shifting trends with today’s market updates, and uncover emerging opportunities using the Serrari Group Market Index and Marketplace. Then, take control of your own financial future by exploring our Money & Life Reset Transformation Blueprint ™ to build stronger habits, create better systems, and design a path toward lasting wealth.
The Fed Hold Did Not Calm Markets
The Federal Reserve held the federal funds target range at 3.50%–3.75%, but the market reaction suggests investors did not treat the decision as fully reassuring. Barron’s reported that the July statement kept the target range unchanged while some members preferred a rate increase, underlining a more hawkish policy backdrop.
For technology stocks, the problem is not only the current rate. It is the possibility that inflation, oil prices or wage pressure could keep future policy tighter than investors expected.
Technology Concentration Is the Real Risk
The Nasdaq-100’s weakness highlights index concentration. If a few large technology companies dominate returns, an investor may be less diversified than the word “index” suggests. Earnings from Microsoft, Meta, Nvidia, Amazon and Apple can therefore influence broad index direction more than many smaller components combined.
This does not mean investors should avoid technology. It means they should understand whether their index exposure is actually broad market exposure or concentrated growth exposure.
Volatility Is Back in the Conversation
Cboe’s VIX futures page remains a key volatility reference for investors tracking market stress. A VIX near the high teens or around 20 is not a crisis level, but it signals that investors are paying more attention to downside protection and earnings uncertainty.
The risk is that volatility can feed on itself when crowded trades unwind. If technology selling forces index funds, options hedgers or leveraged investors to reduce exposure at the same time, a correction can deepen quickly.
What Investors Should Watch
Investors should watch whether weakness remains concentrated in megacap technology or spreads into financials, industrials, healthcare and small caps. A narrow tech correction is different from a broad market deterioration.
They should also watch Treasury yields, oil prices, VIX levels and the next earnings reactions from the largest Nasdaq-linked companies. A strong recovery in earnings confidence could stabilise the index. A renewed rise in yields or oil could extend the correction.
Conclusion
The Nasdaq 100 Correction is a serious test of the US technology rally. The Dow’s 1,153-point loss was visually dramatic, but the Nasdaq-100’s move into correction territory says more about portfolio concentration, rate sensitivity and investor confidence in AI-linked growth.
The key lesson is that index exposure still needs risk analysis. A technology-heavy benchmark can deliver strong upside during growth phases, but it can also fall quickly when inflation, bond yields and earnings expectations move against it.
FAQs
1. What is a Nasdaq-100 correction?
A correction generally means an index has fallen at least 10% from a recent high. Market coverage reported that the Nasdaq-100 had fallen more than 10% from its June 2 record close, placing it in correction territory.
2. How did major US indices perform on July 29?
AP reported that the S&P 500 fell 1.5%, the Dow fell 2.2%, the Nasdaq Composite fell 1.7% and the Russell 2000 fell 1.6% on July 29.
3. Why is this correction important?
It matters because the Nasdaq-100 is heavily linked to technology and AI-exposed companies. A correction can signal valuation pressure in the companies that have led the wider US equity rally.
4. Did the Fed cause the sell-off?
The sell-off should not be attributed solely to the Fed. The market was reacting to several forces, including oil prices, inflation concerns, Treasury yields, technology earnings and index concentration.
5. What should investors watch next?
Investors should monitor whether technology weakness spreads to broader market sectors, whether VIX rises, whether Treasury yields keep climbing, and whether major technology earnings restore confidence.
Sources: AP News, The Wall Street Journal, Nasdaq Indexes, Cboe Global Markets, Federal Reserve, Barron’s
Your financial future isn’t something you wait for—it’s something you build.
The real question is: when do you begin?
Move beyond simply staying informed.
Navigate the markets with clarity—track trends through the Serrari Group Market Index, uncover opportunities in the Serrari Marketplace, and build practical knowledge with our Curated Wealth Builder Platform.
Stay connected to what truly matters.
Get daily insights on macro trends and financial movements across Kenya, Africa, and global markets—delivered through the Serrari Newsletter.
Growth opens doors.
Advance your career through professional programs including ACCA, HESI A2, ATI TEAS 7 , HESI EXIT , NCLEX – RN and NCLEX – PN, Financial Literacy!🌟—designed to move you forward with confidence.
See where money is flowing—clearly and in real time.
Track Money Market Funds, Treasury Bills, Treasury Bonds, Green Bonds, and Fixed Deposits, alongside global and African indexes, key economic indicators, and the evolving Crypto and stablecoin landscape—all within Serrari’s Market Index.