


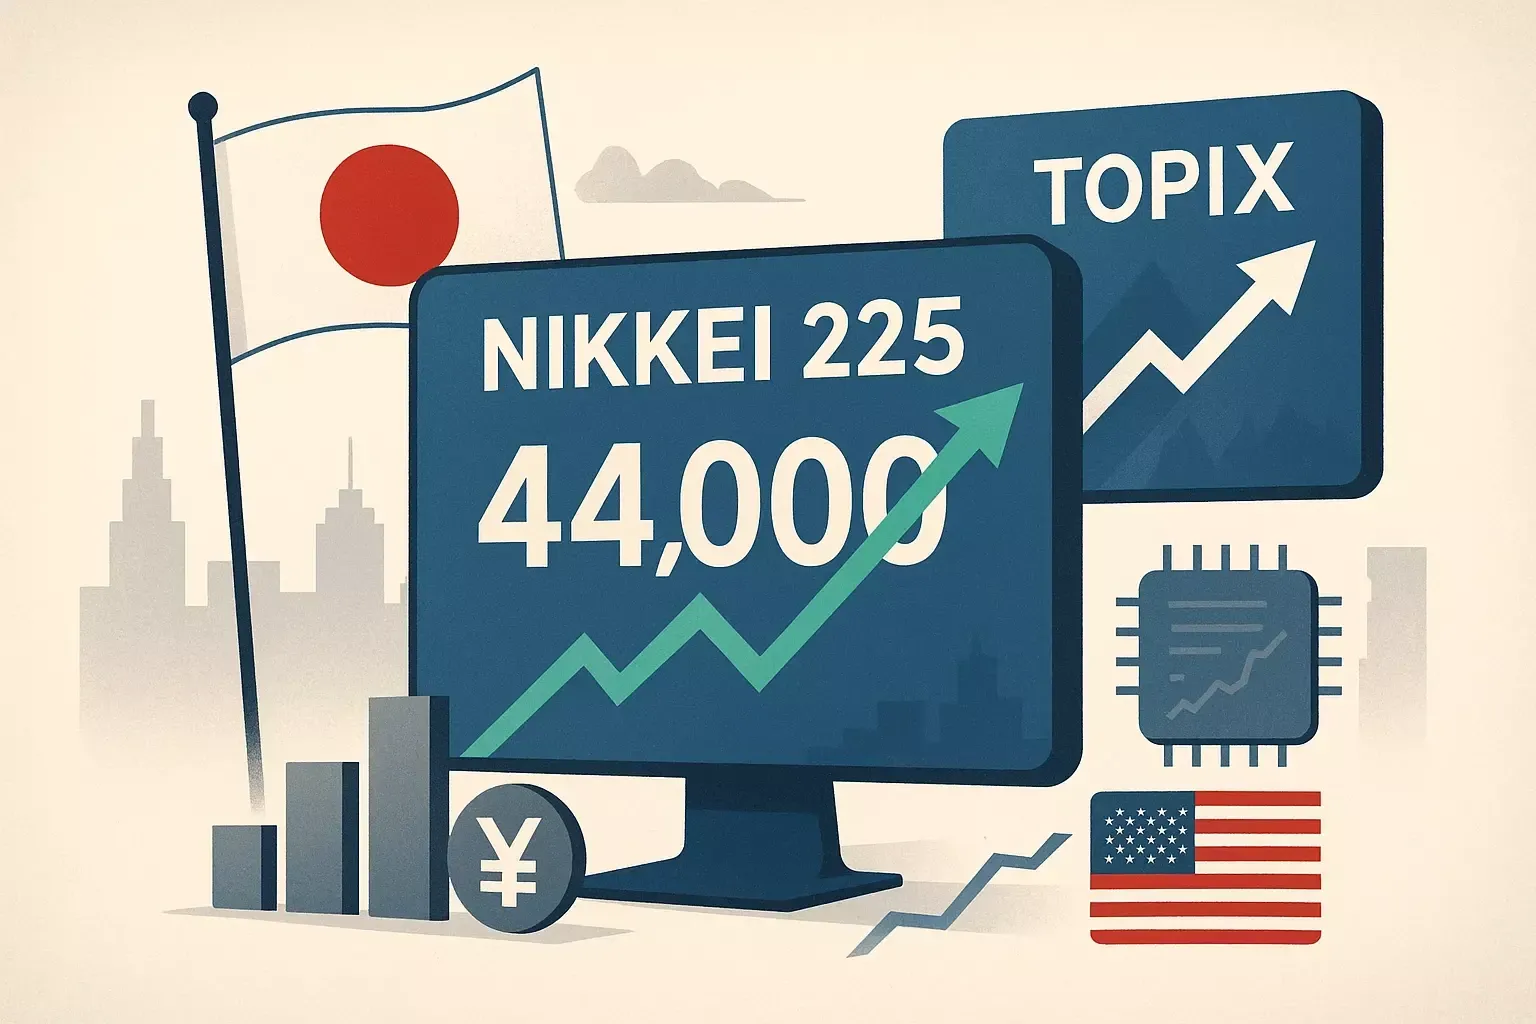
Japan’s Nikkei 225 rebounded on August 20 after losing about 5.6% over the previous two trading sessions.
The index’s volatility is easier to understand once investors look at how it is constructed. Unlike many global benchmarks that weight companies mainly by market capitalisation, the Nikkei 225 is a modified price-weighted index.
That gives some high-priced shares, particularly technology and semiconductor companies, unusually large influence over daily index movements.
For investors using Nikkei-linked ETFs or other index products, understanding that concentration is essential: owning the Nikkei 225 does not mean every Japanese company contributes equally to its performance.
Key Overview
- August 17 close: 69,220.25
- August 19 close: 65,326.42
- Two-session decline: approximately 5.6%
- August 20 close: 66,216.79
- August 20 gain: 1.36%
- August 17 index-weighted P/E: 23.02x
- Top three constituent weights: approximately 30.8%
- Number of constituents: 225
Nikkei 225 Rebounds After a 5.6% Two-Day Market Slide
Japan’s Nikkei 225 bounced on Thursday, but the speed of both the decline and recovery highlights something investors can easily overlook about the benchmark.
The index is not built like the S&P 500.
After reaching an August 17 close of 69,220.25, the Nikkei fell sharply over the following two sessions and closed August 19 at 65,326.42.
That represented a decline of approximately 5.6%.
The August 20 close of 66,216.79 then produced an 890.37-point, or 1.36%, rebound.
But even after Thursday’s recovery, the index remained roughly 4.3% below its August 17 level.
Why the Nikkei Can Swing So Hard
The answer starts with methodology.
The Nikkei contains 225 companies listed on the Tokyo Stock Exchange, but company size alone does not determine how much each stock affects the benchmark.
Nikkei’s official index calculation methodology keeps the benchmark fundamentally price weighted, although price-adjustment factors and other controls are applied.
That contrasts with a market-cap-weighted index, where a company’s total equity value largely determines its weight.
In practical terms, a relatively high-priced Nikkei constituent can have a much greater influence on the index than a lower-priced company with a larger overall market capitalisation.
That helps explain why movements in a small number of technology names can create dramatic headline moves.
Three Companies Carry Huge Weight
The concentration is striking.
In Nikkei’s official August 17 summary, Advantest represented 13.17% of the index, Fast Retailing 8.93% and Tokyo Electron 8.73%.
Together, those three represented approximately 30.83% of the entire benchmark.
That means three companies among 225 constituents accounted for almost one-third of index weight at that snapshot.
Two of those three—Advantest and Tokyo Electron—are directly exposed to semiconductor and technology-investment cycles.
When global AI and chip shares are rising, that concentration can strongly accelerate Nikkei gains.
When investors suddenly reduce technology exposure, the same mechanism works in reverse.
Advantest Became So Large Nikkei Intervened
Concentration has become significant enough for Nikkei itself to respond.
Nikkei announced that the Advantest weight exceeded 10% at the July review reference date.
From October 1, its capping ratio will therefore be reduced from 0.9 to 0.8, lowering the capped price-adjustment factor used in calculating its contribution.
That does not remove Advantest’s importance.
It shows how influential the stock has become.
Context is everything. Stay ahead of shifting trends with today’s market updates, and uncover emerging opportunities using the Serrari Group Market Index and Marketplace. Then, take control of your own financial future by exploring our Money & Life Reset Transformation Blueprint ™ to build stronger habits, create better systems, and design a path toward lasting wealth.
Technology Drove the Selloff
Wednesday’s decline demonstrated the effect clearly.
The Nikkei fell 3.2% on August 19 as global investors reduced risk amid rising bond yields, oil prices and geopolitical uncertainty.
Technology-related shares were among the hardest hit.
Kioxia fell about 13%, SoftBank Group roughly 10%, while chip and AI-linked stocks suffered broad pressure.
A price-weighted index with large technology exposure naturally magnifies that kind of sector shock.
Thursday’s Rebound Was Broader
The August 20 recovery was more constructive because buying extended beyond only the largest semiconductor names.
The Nikkei rose 1.36% Thursday to 66,216.79 as global bond-market pressure eased and investors returned to risk assets.
That rebound is encouraging, but it did not erase the earlier damage.
The index recovered less than one-quarter of the roughly 3,894 points lost between the August 17 and August 19 closes.
Investors therefore need more than one positive session before concluding that the correction is finished.

Nikkei 225 infographic showing the index falling from 69,220 on August 17 to 65,326 on August 19, a decline of approximately 5.6%, before rebounding to 66,217 on August 20. A concentration panel shows Advantest at 13.17%, Fast Retailing at 8.93% and Tokyo Electron at 8.73% of index weight.
Valuation Also Matters
The market entered the selloff at relatively elevated valuations.
The August 17 valuation snapshot showed an index-weighted P/E of 23.02 times and P/B of 2.86 times.
The same snapshot put the combined market capitalisation of Nikkei constituents at approximately ¥1,075 trillion and daily trading value at ¥7.41 trillion.
Higher valuations do not automatically mean the market must fall.
But they can make expensive growth stocks more sensitive when bond yields rise because investors begin demanding greater returns to justify their valuations.
What Investors Should Watch
Investors using Nikkei-linked ETFs should monitor more than the headline index.
Important signals include:
- Advantest and Tokyo Electron;
- Wider semiconductor performance;
- Japanese government-bond yields;
- USD/JPY movements;
- U.S. technology shares; and
- Whether gains broaden beyond the largest index weights.
That last point matters most.
If the Nikkei rises while only a handful of heavyweight companies advance, the headline index may exaggerate the strength of the broader Japanese market.
Conclusion
The Nikkei 225’s 5.6% two-session slide and Thursday rebound demonstrate why index construction matters.
The benchmark contains 225 companies, but its performance is far from equally distributed across them.
A few high-weight technology and consumer names can move the index dramatically.
For global investors, the lesson is straightforward: buying a Nikkei-linked product gives exposure to Japanese equities, but it also brings meaningful concentration in several unusually influential stocks.
Understanding those weights helps explain why Japan’s best-known index can sometimes move much faster than the broader economy or stock market beneath it.
FAQs
Why did the Nikkei fall so quickly?
Technology and semiconductor shares experienced heavy selling as global bond yields, oil prices and risk concerns rose. Because several technology names have unusually large Nikkei weights, their declines had a significant impact on the overall index.
Is the Nikkei 225 market-cap weighted?
No. It is a modified price-weighted index. Share prices are adjusted using specified factors, and the resulting adjusted prices determine each constituent’s influence rather than company market capitalisation alone.
Did the August 20 rebound recover the selloff?
Only partially. The Nikkei gained 1.36% to 66,216.79 but remained roughly 4.3% below its August 17 close.
Why should ETF investors care about index weighting?
An ETF tracking the Nikkei replicates the index methodology. Investors therefore inherit its concentration characteristics, including the large influence of stocks such as Advantest, Fast Retailing and Tokyo Electron.
Sources: Nikkei Inc.; Nikkei Indexes Daily Summary; Nikkei 225 methodology and capping notices; Yahoo Finance; Barron’s; Associated Press.
Your financial future isn’t something you wait for—it’s something you build.
The real question is: when do you begin?
Move beyond simply staying informed.
Navigate the markets with clarity—track trends through the Serrari Group Market Index, uncover opportunities in the Serrari Marketplace, and build practical knowledge with our Curated Wealth Builder Platform.
Stay connected to what truly matters.
Get daily insights on macro trends and financial movements across Kenya, Africa, and global markets—delivered through the Serrari Newsletter.
Growth opens doors.
Advance your career through professional programs including ACCA, HESI A2, ATI TEAS 7 , HESI EXIT , NCLEX – RN and NCLEX – PN, Financial Literacy!🌟—designed to move you forward with confidence.
See where money is flowing—clearly and in real time.
Track Money Market Funds, Treasury Bills, Treasury Bonds, Green Bonds, and Fixed Deposits, alongside global and African indexes, key economic indicators, and the evolving Crypto and stablecoin landscape—all within Serrari’s Market Index.