




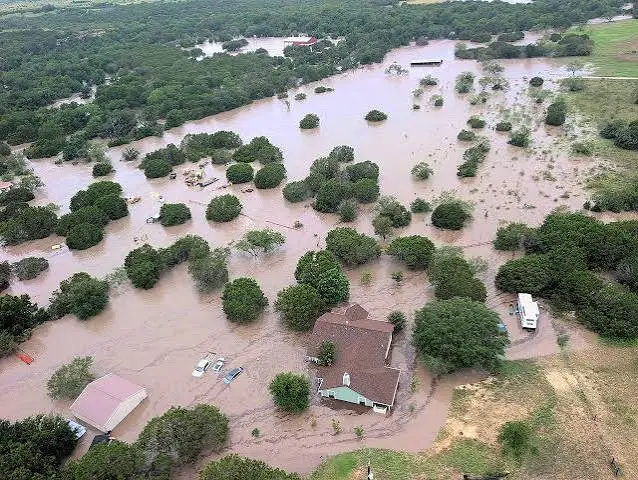
Natural catastrophes generated an estimated $91 billion in insured losses worldwide during the first nine months of 2026, even as total disaster damage fell below historical norms. The third-quarter catastrophe assessment, published on October 29, estimated economic losses of $204 billion and found that approximately 55% of the damage was uninsured. Severe thunderstorms, European drought and destructive South American earthquakes exposed the uneven financial consequences of disasters across regions.
Key Overview
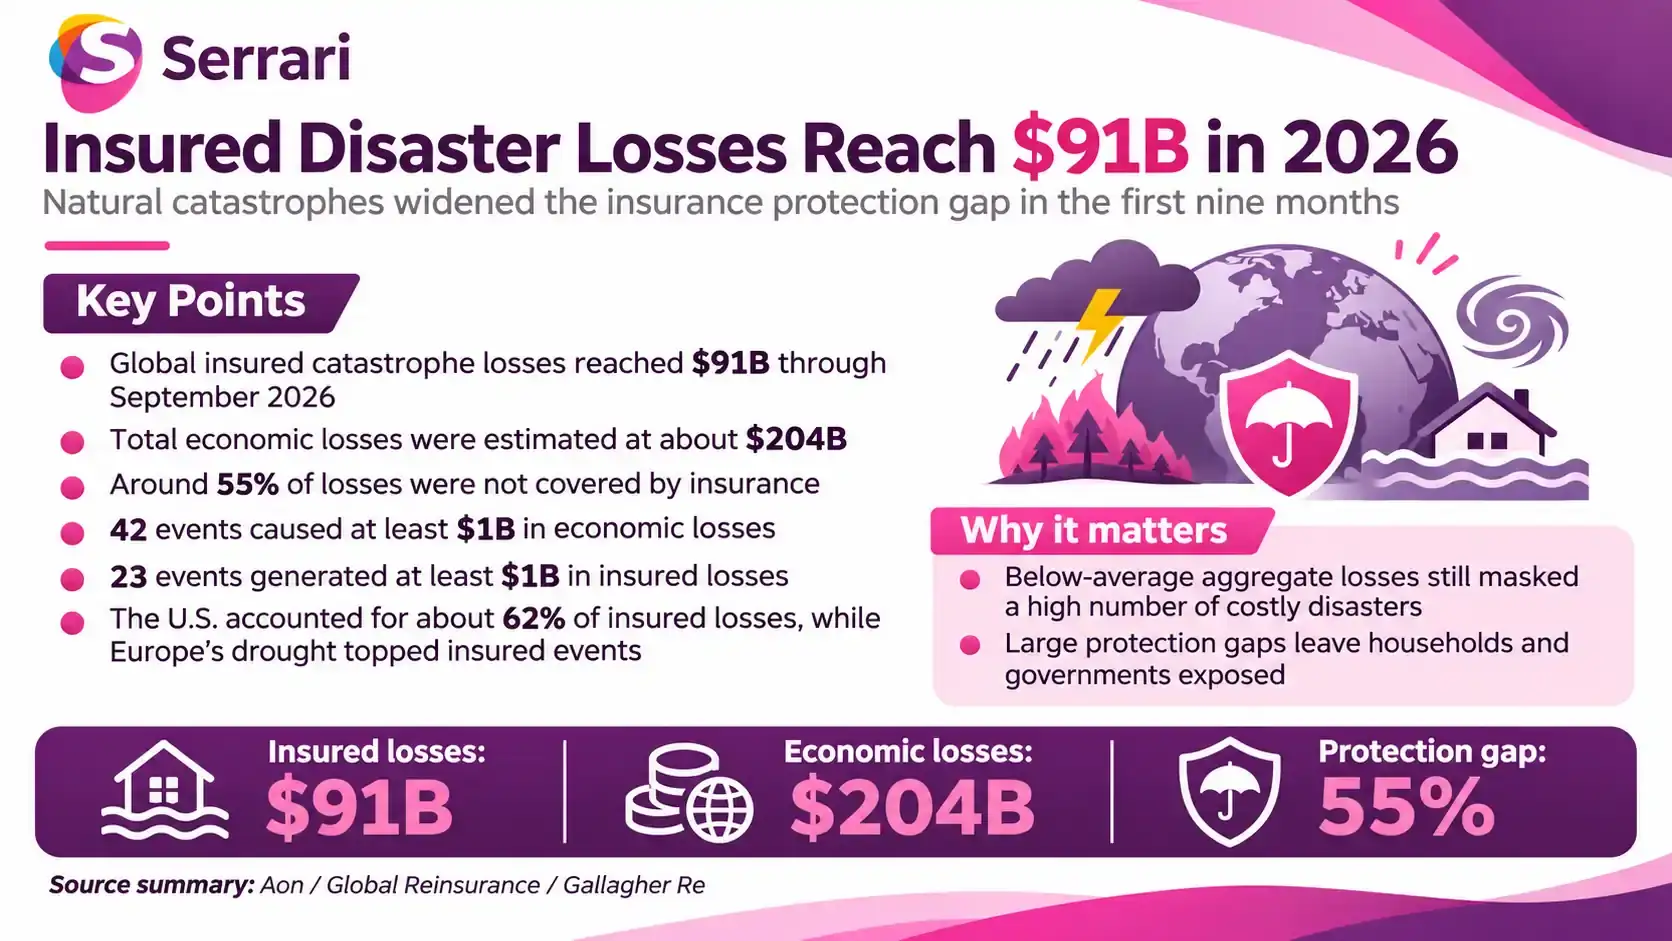
- Insured losses: $91 billion through September, above the 21st-century average of $88 billion but below the recent five-year average of $135 billion.
- Economic losses: Approximately $204 billion, or 31% below the 21st-century average.
- Protection gap: Roughly 55% of economic losses were not covered by insurance.
- Major catastrophes: 42 events caused at least $1 billion in economic losses; 23 produced at least $1 billion in insured losses.
- Largest events: European drought caused more than $8.5 billion in insured losses, while the Venezuela earthquake generated an estimated $25 billion in economic damage.
Insured Losses Fall Below Recent Highs Despite Frequent Disasters
The $91 billion insured-loss estimate was the lowest January-to-September total since 2019, although it remained slightly above the longer-term average. Global economic losses were the lowest for the equivalent period since 2015. Those figures might suggest a quieter catastrophe year, but they disguise the frequency of expensive events.
The nine-month loss breakdown identified 42 disasters causing at least $1 billion in economic damage, against a historical average of 37. Another 23 events generated insured losses of at least $1 billion each, compared with an average of 14. Lower aggregate losses therefore coexisted with a greater-than-usual number of costly insured events.
Severe convective storms, including damaging thunderstorms, hail and tornadoes, were the most expensive category for both economic and insured losses. The United States accounted for 62% of worldwide insured catastrophe losses, reflecting significant storm damage and comparatively extensive insurance coverage.
European Drought and South American Earthquakes Drive Damage
Persistent heat and drought across Europe from May to September produced more than $8.5 billion in insured losses, making the combined drought episode the costliest insured catastrophe of the period. France accounted for about $5 billion in insured losses, with dry soils contributing to ground subsidence and damage to buildings.
South America illustrated a different problem: large economic losses without comparable insurance protection. The June 24 earthquake in Venezuela caused an estimated $25 billion in economic damage, the highest for a single event during the first nine months. Much of that damage was expected to remain uninsured because of limited market capacity and insurance penetration.
An August 10 earthquake in Colombia caused an estimated $9.6 billion in economic losses, making it the costliest event of the third quarter. Unlike Venezuela, Colombia was expected to benefit from established reinsurance programmes and catastrophe reserves, according to the regional catastrophe findings.
Context is everything. Stay ahead of shifting trends with today’s market updates, and uncover emerging opportunities using the Serrari Group Market Index and Marketplace. Then, take control of your own financial future by exploring our Money & Life Reset Transformation Blueprint ™ to build stronger habits, create better systems, and design a path toward lasting wealth.
The $113 Billion Difference Reveals an Insurance Gap
The difference between the estimated $204 billion in economic losses and $91 billion in insured losses was approximately $113 billion. This represents the report’s roughly 55% global protection gap: damage financed by households, companies, governments and other sources rather than insurance claims.
The gap is not evenly distributed. Areas with broader property insurance and stronger reinsurance markets can transfer more losses to insurers, while underinsured communities face larger rebuilding costs and greater pressure on public budgets. The independent nine-month catastrophe review also points to rising exposure and rebuilding costs as important drivers of financial damage, although its estimates differ because assessment methods and event calculations are not identical.
What the Figures Mean for Insurers and Governments
The findings underscore why aggregate annual losses alone are an incomplete measure of catastrophe risk. For insurers, more billion-dollar events increase the importance of pricing, reserves, reinsurance and geographic diversification. Governments face a related challenge: investing in resilience and making financial protection more accessible before disasters strike.
With the final quarter still unaccounted for in these estimates, the 2026 full-year outcome could change significantly. The more durable lesson is that a below-average economic-loss total can still leave communities facing severe damage and limited insurance support.
Sources: Aon / Global Reinsurance / Reinsurance News / Gallagher Re
Your financial future isn’t something you wait for—it’s something you build.
The real question is: when do you begin?
Move beyond simply staying informed.
Navigate the markets with clarity—track trends through the Serrari Group Market Index, uncover opportunities in the Serrari Marketplace, and build practical knowledge with our Curated Wealth Builder Platform.
Stay connected to what truly matters.
Get daily insights on macro trends and financial movements across Kenya, Africa, and global markets—delivered through the Serrari Newsletter.
Growth opens doors.
Advance your career through professional programs including ACCA, HESI A2, ATI TEAS 7 , HESI EXIT , NCLEX – RN and NCLEX – PN, Financial Literacy!🌟—designed to move you forward with confidence.
See where money is flowing—clearly and in real time.
Track Money Market Funds, Treasury Bills, Treasury Bonds, Green Bonds, and Fixed Deposits, alongside global and African indexes, key economic indicators, and the evolving Crypto and stablecoin landscape—all within Serrari’s Market Index.