





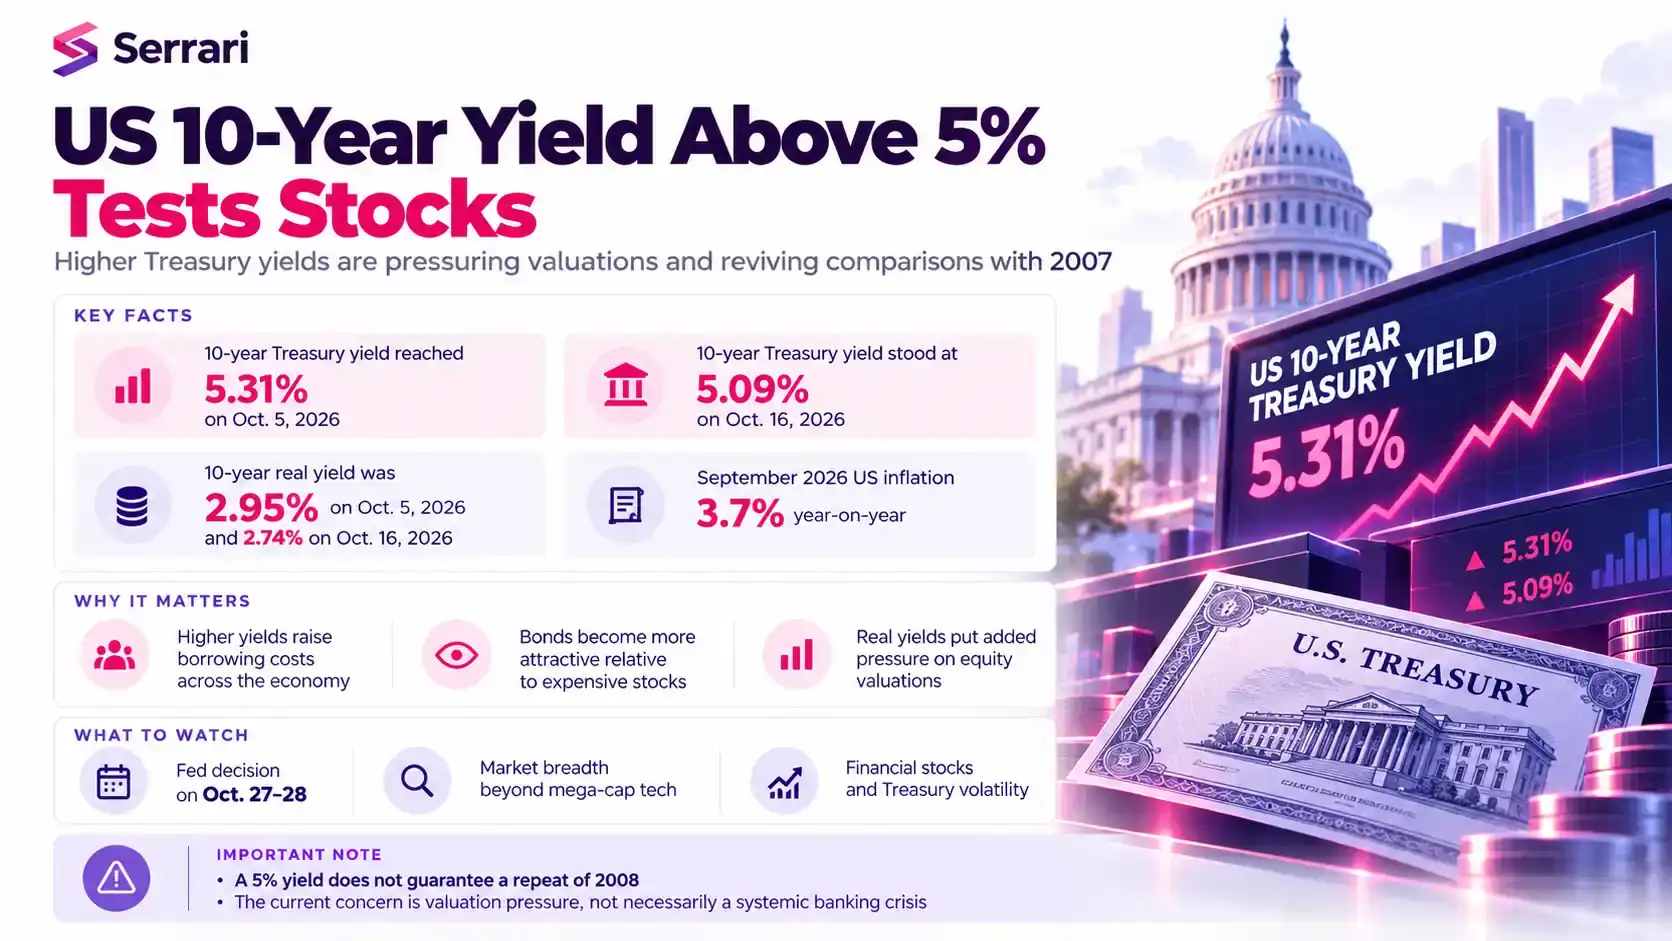
The US 10-year Treasury yield has returned to levels last seen in 2007, creating fresh pressure on stock valuations and borrowing costs. After reaching 5.31% on October 5, 2026, the benchmark eased to 5.09% on October 16, according to official daily yield observations. The move has revived comparisons with the period preceding the global financial crisis, although today’s risks and economic conditions are different.
Key Overview
- The 10-year Treasury yield reached 5.31% on October 5 before declining to 5.09% on October 16, 2026.
- The benchmark crossed 5% in September, returning to a level not seen since 2007.
- Higher inflation-adjusted yields make bonds more competitive and put pressure on expensive stocks.
- September US consumer inflation reached 3.7% annually, adding uncertainty over further interest-rate increases.
- Investors are watching financial stocks, broader market participation and Treasury-market volatility for signs of stress.
Why a 5% Treasury Yield Matters for Stocks
The 10-year Treasury yield is a widely followed benchmark for US borrowing costs and a reference point for valuing other investments. When it rises, newly issued bonds offer more income, while mortgages, corporate debt and other financing can become more expensive.
Higher yields also change how investors value future company profits. Because those profits are discounted at higher interest rates, stocks trading on ambitious growth expectations can be especially vulnerable. The effects are not uniform: companies with strong earnings and manageable debt may cope better than businesses dependent on cheap financing.
Crucially, inflation-adjusted rates have also climbed. The 10-year real yield data show a real yield of 2.95% on October 5, declining to 2.74% by October 16. High real yields can weigh on equity valuations even when long-term inflation expectations are relatively contained.
Why the 2007 Comparison Needs Caution
The return of 5% Treasury yields recalls 2007, when US equities were near record levels before the financial crisis devastated markets. However, the yield threshold did not itself cause that collapse.
The history of the 2007–2009 recession shows that mortgage losses, securitised credit exposures and severe financial-sector disruption were central to the crisis. Today’s higher yields reflect a different mix of inflation concerns, economic resilience, borrowing needs and uncertainty about monetary policy.
A 5% yield therefore signals more expensive capital, not a prediction that the 2008 market collapse will repeat. Whether stocks suffer a deeper decline depends on corporate earnings, credit conditions, inflation and the strength of financial institutions.
Context is everything. Stay ahead of shifting trends with today’s market updates, and uncover emerging opportunities using the Serrari Group Market Index and Marketplace. Then, take control of your own financial future by exploring our Money & Life Reset Transformation Blueprint ™ to build stronger habits, create better systems, and design a path toward lasting wealth.
Stock Market Breadth Comes Under Pressure
One concern is the gap between major stock indexes and the wider market. Large technology companies carry significant weight in the conventional S&P 500, meaning their performance can support the headline index even as many smaller constituents struggle.
In recent analysis of tightening financial conditions, Morgan Stanley strategist Mike Wilson identified financial-sector performance and Treasury-market volatility as important signals for the broader equity outlook.
Investors should distinguish a market decline affecting most companies from weakness concentrated in a handful of heavily weighted stocks. Comparing the capitalisation-weighted and equal-weighted S&P 500, alongside trends in bank shares, can help reveal that difference.
Inflation and the Fed’s Next Decision
The Federal Reserve raised its policy-rate range by 25 basis points to 3.75%–4.00% on September 16, 2026, citing inflation that remained above its objective.
Subsequently, the September consumer price report showed annual inflation of 3.7%, with prices rising 0.6% during the month. Gasoline prices increased 9.1% month on month, making a major contribution to the overall rise.
The next policy meeting is scheduled for October 27–28. Chair Kevin Warsh declined to pre-announce a rate decision during remarks on October 16, leaving investors to weigh persistent inflation against the tightening already delivered by bond markets.
What Investors Should Watch Next
Three developments will help determine whether the stock market stabilises: whether Treasury yields retreat sustainably, whether financial shares recover, and whether gains broaden beyond the largest companies. The MOVE index, a gauge of expected Treasury-market volatility, provides another window into bond-market stress.
The 2007 comparison is a reminder that elevated borrowing costs can expose vulnerabilities, but it is not a reliable forecast by itself. In the weeks ahead, inflation trends, the Fed’s October decision and company earnings will provide stronger evidence about the direction of US equities.
Sources: U.S. Department of the Treasury / Federal Reserve / Federal Reserve History / U.S. Bureau of Labor Statistics / MarketWatch / Associated Press
Your financial future isn’t something you wait for—it’s something you build.
The real question is: when do you begin?
Move beyond simply staying informed.
Navigate the markets with clarity—track trends through the Serrari Group Market Index, uncover opportunities in the Serrari Marketplace, and build practical knowledge with our Curated Wealth Builder Platform.
Stay connected to what truly matters.
Get daily insights on macro trends and financial movements across Kenya, Africa, and global markets—delivered through the Serrari Newsletter.
Growth opens doors.
Advance your career through professional programs including ACCA, HESI A2, ATI TEAS 7 , HESI EXIT , NCLEX – RN and NCLEX – PN, Financial Literacy!🌟—designed to move you forward with confidence.
See where money is flowing—clearly and in real time.
Track Money Market Funds, Treasury Bills, Treasury Bonds, Green Bonds, and Fixed Deposits, alongside global and African indexes, key economic indicators, and the evolving Crypto and stablecoin landscape—all within Serrari’s Market Index.