





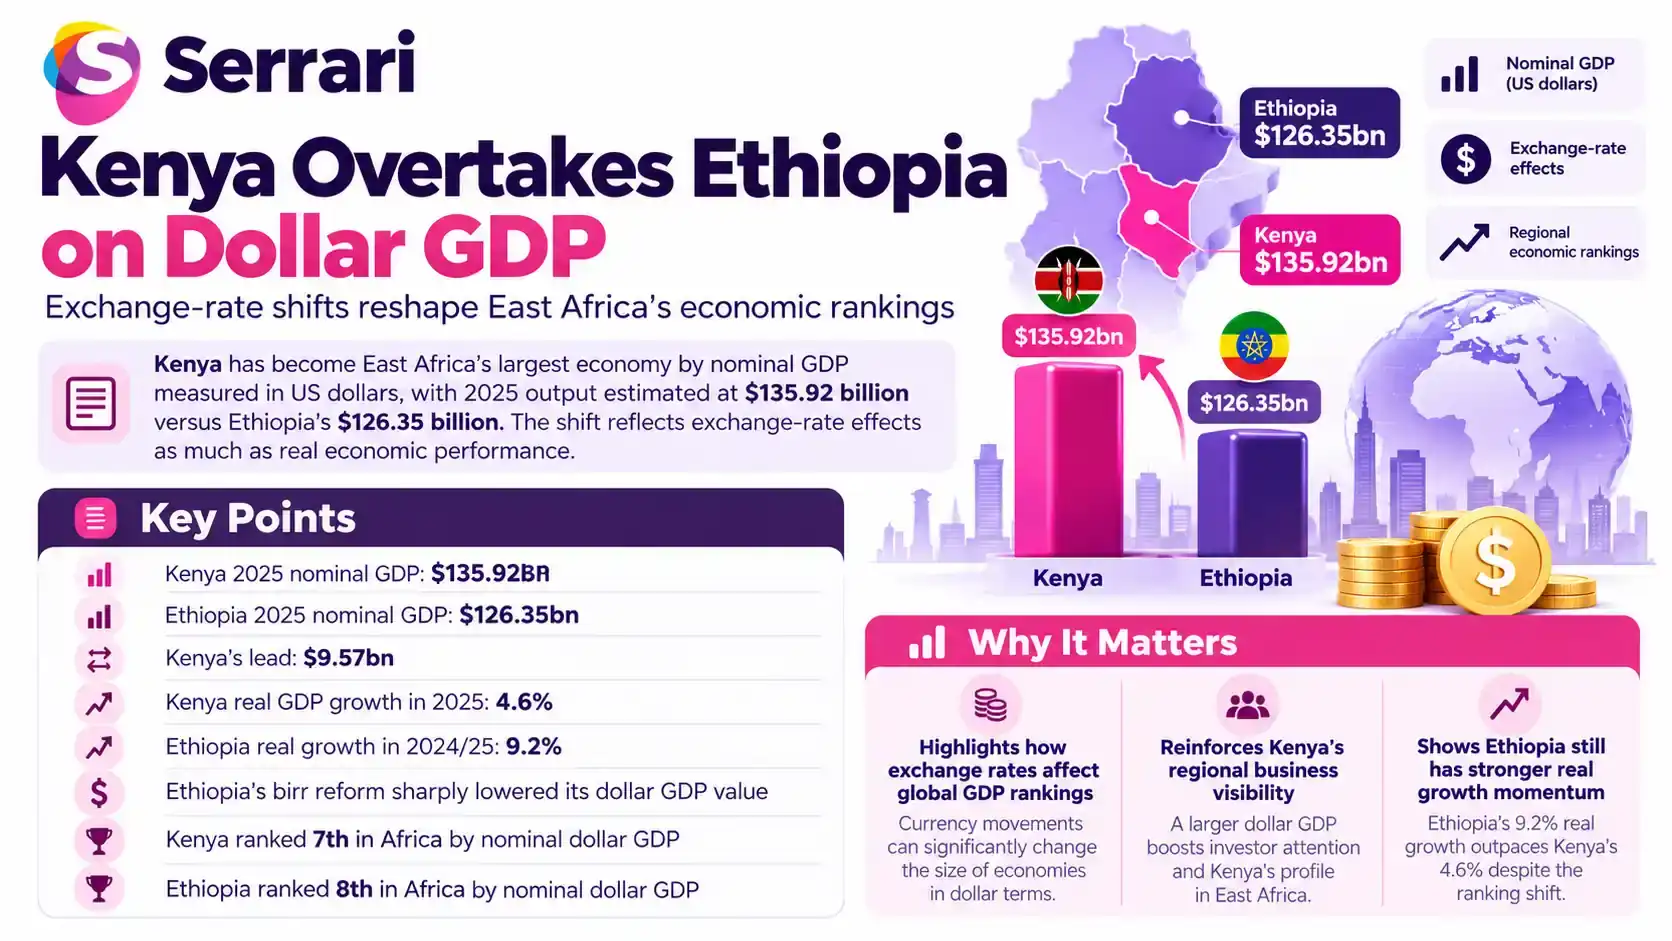
Kenya has overtaken Ethiopia as East Africa’s largest economy by nominal gross domestic product (GDP) measured in US dollars, according to figures from the October 2026 economic database. Kenya’s economy was valued at $135.92 billion in 2025, compared with $126.35 billion for Ethiopia, giving Kenya a $9.57 billion lead.
The change was driven largely by exchange-rate movements, not a collapse in Ethiopian production. Ethiopia continued to expand faster in real terms, while the depreciation of its birr substantially reduced the dollar value assigned to its output.
Key Overview
- Kenya’s nominal GDP: $135.92 billion in 2025, equivalent to approximately KSh17.57 trillion.
- Ethiopia’s nominal GDP: $126.35 billion, around $9.57 billion below Kenya.
- Real economic growth: Kenya grew 4.6% in 2025; Ethiopia recorded 9.2% growth for its 2024/25 fiscal year.
- Currency effect: Ethiopia’s move towards a market-determined exchange rate in July 2024 reduced the birr’s external value.
- African rankings: The reported dollar-GDP comparison places Kenya seventh and Ethiopia eighth on the continent.
- Important distinction: Nominal GDP in dollars is not the same as purchasing-power-adjusted GDP or a measure of household prosperity.
How Kenya Moved Ahead in Dollar GDP
The regional GDP comparison shows Kenya’s nominal output increasing by about 13.7% in US-dollar terms during 2025. Ethiopia’s corresponding figure fell from approximately $210 billion in 2024 to $126.35 billion, a decline of nearly 40%.
Those changes should not be interpreted as equivalent movements in the volume of goods and services produced. Dollar-denominated GDP is generally calculated by converting output valued in local currency at prevailing exchange rates. A weaker currency can therefore shrink a country’s reported dollar GDP even when its economy is growing after adjusting for inflation.
Kenya’s official national accounts recorded real growth of 4.6% in 2025, compared with 4.7% in 2024. Nominal output reached roughly KSh17.58 trillion, with expansion across agriculture, construction, finance and other sectors.
Context is everything. Stay ahead of shifting trends with today’s market updates, and uncover emerging opportunities using the Serrari Group Market Index and Marketplace. Then, take control of your own financial future by exploring our Money & Life Reset Transformation Blueprint ™ to build stronger habits, create better systems, and design a path toward lasting wealth.
Ethiopia’s Birr Reform Changed the Comparison
In July 2024, Ethiopia introduced a more market-determined exchange-rate system after years of tight controls on the birr. The policy was part of an economic reform and financing arrangement supported by a four-year, approximately $3.4 billion programme.
As the birr depreciated, Ethiopia’s GDP translated into fewer US dollars. The reform also aimed to ease foreign-exchange shortages, improve price signals and support external economic stability, although currency depreciation can increase the local cost of imported goods.
A subsequent assessment of the reforms found improved foreign-exchange availability, while emphasising the need to maintain macroeconomic stability. The new GDP ranking therefore reflects a major currency adjustment as much as the relative economic performance of the two countries.
Ethiopia Still Recorded Faster Real Growth
Ethiopia’s economy grew by 9.2% in the 2024/25 fiscal year, according to a 2026 programme review, supported by activity in sectors including manufacturing, construction and agriculture. That rate was roughly twice Kenya’s 4.6% calendar-year growth in 2025, although the reporting periods are not identical.
This illustrates why economic rankings require context. Nominal GDP at market exchange rates is useful for comparing output valued in a common international currency. Purchasing-power-parity measures adjust for price-level differences, while GDP per capita, productivity and household income provide different perspectives on economic welfare.
What the Ranking Means for Investment
The latest figures place Kenya seventh among African economies by nominal dollar GDP, followed by Ethiopia in eighth place. For Kenya, a larger dollar-denominated economy may reinforce its visibility to investors, but it does not automatically translate into more jobs, higher wages or stronger export competitiveness.
Both countries have established economic strengths. Kenya hosts significant financial, technology and regional business activity, while Ethiopia has a large domestic market and a major aviation and manufacturing base. Each must address financing, infrastructure and productivity challenges to turn economic scale into sustained improvements in living standards.
The ranking remains sensitive to exchange rates and future data revisions. Kenya currently leads on the reported 2025 dollar-GDP measure, while Ethiopia’s faster real growth presents a different picture of economic momentum.
Sources: International Monetary Fund / Kenya National Bureau of Statistics / Business Daily Africa
Your financial future isn’t something you wait for—it’s something you build.
The real question is: when do you begin?
Move beyond simply staying informed.
Navigate the markets with clarity—track trends through the Serrari Group Market Index, uncover opportunities in the Serrari Marketplace, and build practical knowledge with our Curated Wealth Builder Platform.
Stay connected to what truly matters.
Get daily insights on macro trends and financial movements across Kenya, Africa, and global markets—delivered through the Serrari Newsletter.
Growth opens doors.
Advance your career through professional programs including ACCA, HESI A2, ATI TEAS 7 , HESI EXIT , NCLEX – RN and NCLEX – PN, Financial Literacy!🌟—designed to move you forward with confidence.
See where money is flowing—clearly and in real time.
Track Money Market Funds, Treasury Bills, Treasury Bonds, Green Bonds, and Fixed Deposits, alongside global and African indexes, key economic indicators, and the evolving Crypto and stablecoin landscape—all within Serrari’s Market Index.