

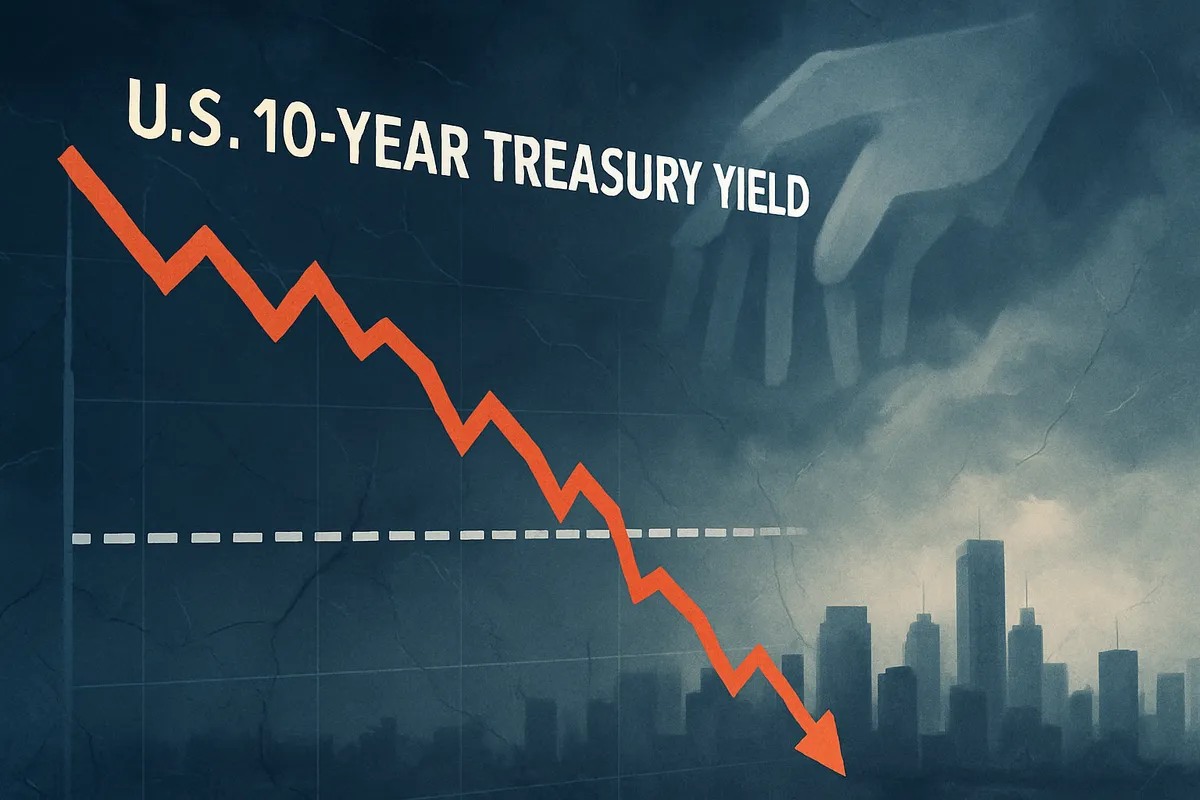
The United States government bond market delivered a nuanced verdict in the days surrounding the Federal Reserve’s March 18, 2026 rate decision: the 10-year Treasury yield declined to approximately 4.18% following the release of the Federal Open Market Committee’s updated Summary of Economic Projections — specifically the “dot plot” that confirmed policymakers’ median expectation of at least one rate cut in 2026. That yield retreat represented a meaningful rally from the highs seen at the peak of the Iran-war-driven oil shock in early March, when the prospect of energy-fuelled inflation and a more hawkish Fed had pushed yields sharply higher.
The movement in the 10-year Treasury yield — the most globally watched benchmark in fixed income markets — is important for multiple reasons. As the foundational risk-free rate against which virtually all other financial assets are priced, the 10-year yield shapes the cost of mortgages, corporate borrowing, sovereign debt across emerging markets and the discount rate applied to equity valuations. A decline from elevated levels signals that the bond market, at least temporarily, interpreted the Fed’s March communications as consistent with a path of eventual easing — even if that easing is delayed and limited to a single cut in 2026.
Markets move fast; don’t get left behind. We’ve paired the Serrari Group Market Index with a curated Marketplace and a comprehensive Wealth Builder Course to ensure you have the data—and the skills—to act on it.
What Moved Yields: The Dot Plot Effect
The immediate catalyst for the yield retreat was the Fed’s dot plot itself. Despite the upward revision to inflation forecasts — with the PCE price index now projected at 2.7% for 2026 on both headline and core bases — the median rate projection for end-2026 remained at 3.4%, unchanged from December 2025. This projection implies that the Fed expects to implement one 25 basis-point cut by year-end, bringing the federal funds rate to 3.25%–3.5%. For bond market investors who had been pricing in the possibility of no cuts at all in 2026 given the oil shock and inflation overshoot, the confirmation that the median FOMC member still expects a cut was incrementally supportive of duration.
The mechanics are straightforward: when the Fed signals rate cuts ahead, the expected future path of short-term rates declines, pulling longer-term yields down via the expectations component of the yield curve. The magnitude of the yield movement — roughly 5 to 10 basis points — was modest, consistent with a market that had already partially priced the dovish dot plot outcome and that remained cautious about the inflation trajectory given energy price uncertainty.
The Yield Curve Context: From Inversion to Normalisation
To appreciate the significance of the 4.18% 10-year yield, it helps to understand where the yield curve has been over the preceding two years. In 2023 and 2024, the US Treasury yield curve was deeply inverted — with short-term rates significantly above long-term rates — reflecting the market’s expectation that the Fed’s aggressive rate-hike cycle would eventually give way to cuts. The inversion was historically unusual and persistently deep, generating widespread recession predictions that ultimately proved premature.
As the Fed began cutting rates in late 2025 — three 25 basis-point reductions in September, October and December — the curve began to normalise, with short rates falling faster than long rates. By March 2026, the 2-year Treasury note yield was trading at approximately 3.714% while the 10-year yield hovered around 4.18-4.23%, representing a positive slope — a more typical yield curve shape in which investors receive a yield premium for holding longer-duration bonds. This steepening of the curve is generally considered positive for bank profitability, as it widens the spread between the rates at which banks borrow (short-term) and lend (long-term).
However, the steepening also reflects a genuine risk premium embedded in long-dated Treasuries. With the Iran conflict creating uncertainty about the medium-term inflation outlook and with significant Treasury issuance required to fund the US fiscal deficit, investors in 10-year and 30-year Treasuries are demanding compensation for the possibility that inflation will prove stickier than the Fed’s baseline projections suggest.
Oil, Iran and the Inflation Uncertainty Premium
The 10-year yield’s trajectory in March 2026 has been importantly shaped by developments in global oil markets. West Texas Intermediate crude surged from pre-conflict levels to peaks above $100 a barrel as the US-Israel military operations against Iran disrupted oil flows through the Persian Gulf — a critical transit route for a substantial share of global oil exports. Higher oil prices feed into consumer price inflation through direct channels (gasoline costs, heating oil) and indirect channels (transportation costs, petrochemical inputs to manufacturing). They also affect producer price inflation, which was running hot at a faster-than-expected pace in February 2026.
From a bond market perspective, the oil shock creates a difficult analytical challenge. Higher energy prices are simultaneously inflationary (pushing prices up, which tends to push yields up) and deflationary in a growth sense (acting as a tax on consumer spending and business activity, which tends to push yields down as growth expectations moderate). The net effect on 10-year yields depends on which channel dominates — and that depends critically on how long the conflict continues and whether alternative oil supply routes can compensate for disrupted Persian Gulf flows.
The fact that oil prices have partially retreated from their $105-$109 peak — with front-month WTI down roughly 20% from the March 8 peak by mid-March — helped stabilise Treasury yields and contributed to the 4.18% reading. Energy market participants interpreted signals of a potential early resolution to the conflict, or at minimum a reduction in its severity, as cause for modest relief in risk pricing.
Context is everything. While you follow today’s updates, use the Serrari Market Index and Marketplace to spot emerging shifts. Need to sharpen your edge? Our Wealth Builder Course turns these insights into a professional-grade strategy.
The US Treasury Market’s Structural Importance
The 10-year Treasury yield’s global importance transcends its role as a US domestic benchmark. It serves as the reference rate for sovereign debt pricing across dozens of countries, including many African nations whose Eurobond spreads are quoted as a margin over US Treasuries. When the 10-year yield declines, emerging market borrowing costs typically fall in parallel — reducing the fiscal burden on governments with dollar-denominated external debt and improving their capacity to service and refinance existing obligations. Kenya’s government, which has navigated Eurobond refinancing pressures in recent years, benefits from a lower US yield environment as it reduces the cost of future external market issuance.
For corporate borrowers, particularly investment-grade issuers who use Treasury yields as the base rate for their bond pricing, the moderation in the 10-year yield from recent highs provides a degree of relief. Companies seeking to refinance maturing debt or raise new capital through bond markets face lower base rates, even if credit spreads remain elevated relative to their 2020-2021 lows. The Federal Reserve’s recent Treasury bill purchase programme — aimed at maintaining ample reserves and managing the maturity profile of its balance sheet — has provided additional technical support for the front end of the yield curve, with effects that ripple through to longer maturities.
Investor Positioning and the Rates Outlook
Global institutional investors navigated the March Fed meeting with a cautious posture on US duration, reflecting the uncertainty about the inflation and oil trajectories. The Bank of America March Global Fund Manager Survey showed that large institutional investors were the most overweight in emerging market stocks since February 2021 and the most overweight in commodities since April 2022, while remaining underweight in the US dollar. This positioning reflected a consensus view that the Fed’s eventual easing — however delayed — would weaken the dollar and support risk assets outside the United States.
The rate sensitivity of the US dollar index is particularly relevant for markets globally. A clean break above 100 on the dollar index would tighten conditions across emerging markets, pressuring local currencies and increasing the cost of dollar-denominated debt service. Powell’s press conference tone, interpreted as measured rather than hawkish, helped prevent the dollar from strengthening sharply — a development that was broadly supportive of the global risk-on trade that had been building since Bitcoin and equities both rallied in the weeks prior to the meeting.
Looking Ahead: Key Yield Signposts for 2026
The 10-year yield trajectory for the remainder of 2026 will be shaped by three primary variables. First, the trajectory of the Iran conflict and its effect on global energy supply — a factor that is inherently unpredictable but whose potential for rapid reversal means that any de-escalation signal could produce a sharp yield rally. Second, the monthly inflation data sequence, with the CPI and PCE reports scheduled between now and the June FOMC meeting providing the key empirical inputs to the Fed’s policy judgement. Third, the confirmation and positioning of Kevin Warsh as Fed Chair — a leadership transition that markets believe may introduce a slightly different communication style, even if the policy framework itself remains anchored in the Fed’s dual mandate of price stability and maximum employment.
The Fed’s projected rate path for 2028, with rates expected to settle around 3%–3.25%, provides a long-term anchor for the 10-year yield. If market participants believe this projection is credible, the 10-year yield should ultimately gravitate toward a range consistent with a 3%–3.25% terminal rate — implying meaningful downside from current levels if the oil shock fades and inflation trajectories normalise.
Your financial future isn’t something you wait for—it’s something you build.
The real question is: when do you begin?
Move beyond simply staying informed.
Navigate the markets with clarity—track trends through the Serrari Group Market Index, uncover opportunities in the Serrari Marketplace, and build practical knowledge with our Curated Wealth Builder Course.
Stay connected to what truly matters.
Get daily insights on macro trends and financial movements across Kenya, Africa, and global markets—delivered through the Serrari Newsletter.
Growth opens doors.
Advance your career through professional programs including ACCA, HESI A2, ATI TEAS 7 , HESI EXIT , NCLEX – RN and NCLEX – PN, Financial Literacy!🌟—designed to move you forward with confidence.
See where money is flowing—clearly and in real time.
Track Money Market Funds, Treasury Bills, Treasury Bonds, Green Bonds, and Fixed Deposits, alongside global and African indexes, key economic indicators, and the evolving Crypto and stablecoin landscape—all within Serrari’s Market Index.
Photo Source: Google
By: Montel Kamau
Serrari Financial Analyst
19th March, 2026


