
29 September 2026
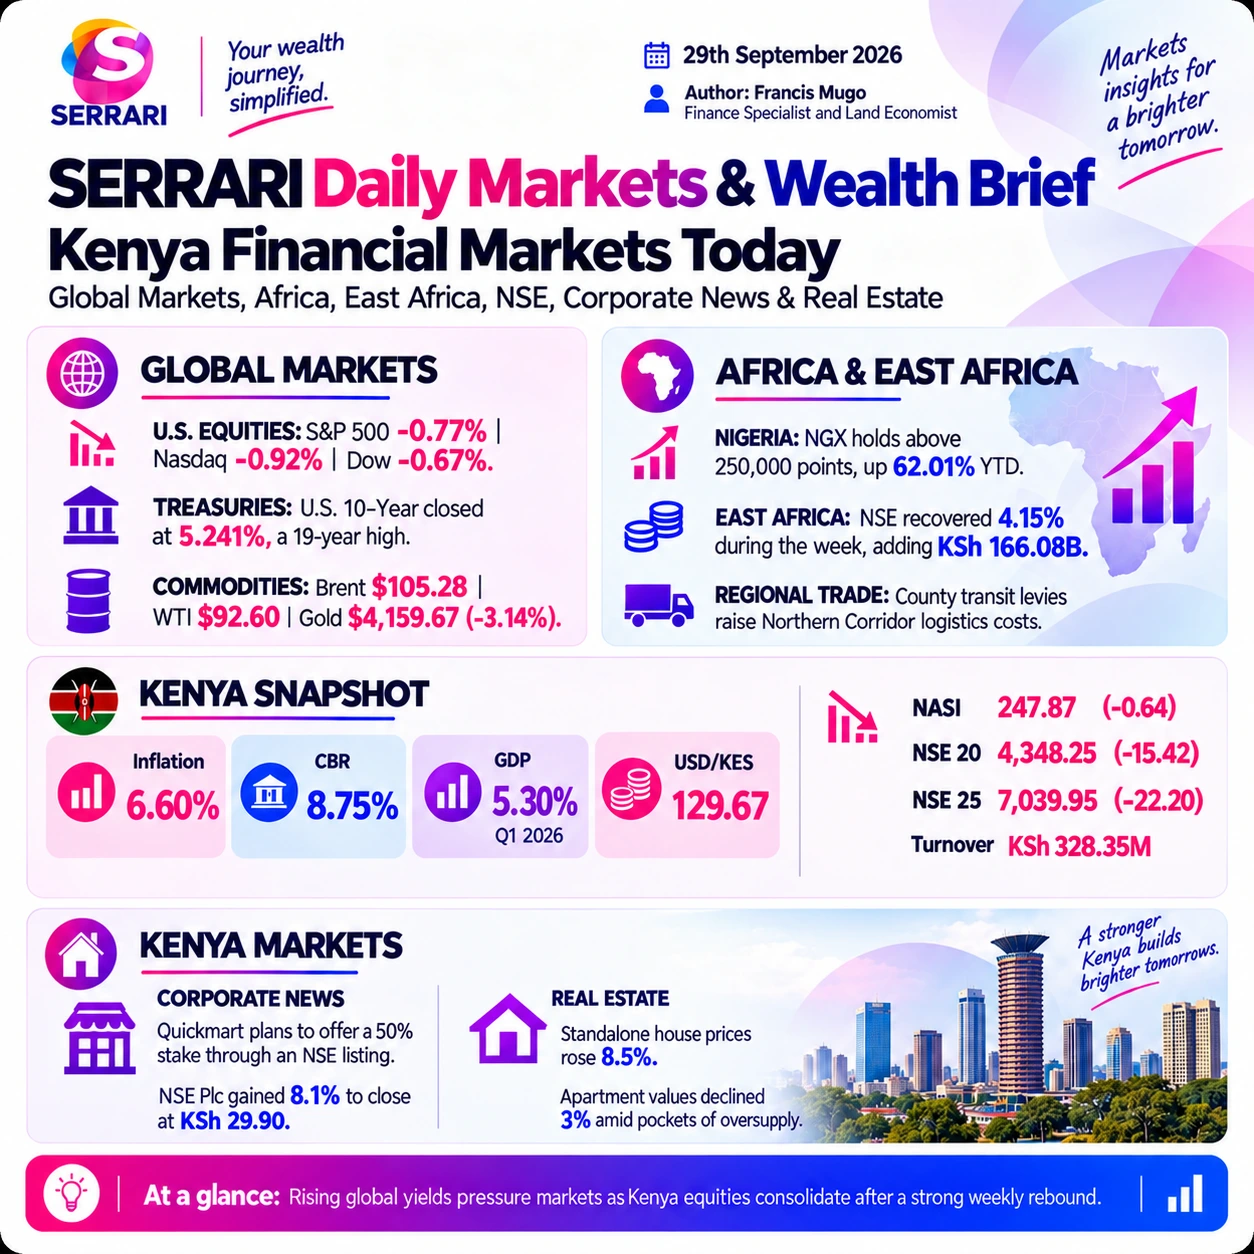
A 19-year high in the US 10-year yield knocked gold 3.14% lower and dragged equities down across three continents. Kenya decoupled — the NSE recovered KSh 166.08 billion over the week and the shilling held at 129.67.

United States
Figures as at · Closing levels for Monday 28 September 2026, as reported in this brief
US stock indices closed lower as geopolitical tensions and rising Treasury yields weighed on sentiment. Markets reacted nervously after President Trump rejected Tehran’s proposal to reopen the Strait of Hormuz.
Major US indices
| Index | Close | Change | Core driver |
|---|---|---|---|
| S&P 500 | 7,683.69 | -0.77% (-59.72) | Weighed down by the jump in the 10-year Treasury yield, which hit a high of 5.23%. |
| Nasdaq Composite | 26,820.38 | -0.92% (-248.34) | Led the decline as chipmakers and hyperscalers fell, Meta down 4.8%, though buffered by a $150 billion buyback from Nvidia. |
| Dow Jones Industrial Average | 51,481.51 | -0.67% (-347.11) | Dragged by Boeing, down roughly 7% after the FAA halted certification on its 737 Max 10 over a software glitch. |
| Russell 2000 | 2,817.91 | -0.69% (-19.64) | Small caps under pressure as escalating oil costs stoked inflation fears. |
Key market drivers
- US–Iran tensions: The rejection of Tehran’s proposal to reopen the Strait of Hormuz pushed Brent crude higher.
- Rising Treasury yields: Yields jumped at the start of a data-heavy economic week, putting added pressure on equities.
- Nvidia buyback and tools: Nvidia announced a $150 billion share buyback authorisation and launched new AI safety tools, OpenShell and Nvidia Sentry.
- Intraday recovery: Midday lows saw the S&P 500 down nearly 1%, but reports of US openness to nuclear sanctions relief for Iran pared the deep losses. Volatility stays elevated ahead of Wednesday’s PCE inflation data and Friday’s September jobs report.
Forex
- Dollar index: The DXY rose 0.2% to close at 101.19 on surging 10-year yields and safe-haven demand.
- EUR/USD: 1.1370 — slipped to a fresh two-month low near 1.1363 intraday as rising oil amplified fears of sticky global inflation.
- USD/JPY: 157.32 — the dollar gained on the widening yield gap as the US 10-year touched 5.23%.
- GBP/USD: 1.3254 (+0.20%) — a short-covering bounce after tumbling to a two-month low of 1.3222 early in the session.
US Treasury Yields
Figures as at · Closing yields for 28 September 2026, as reported in this brief
US Treasury yields surged to multi-decade highs. The benchmark 10-year note settled at 5.241%, a fresh 19-year closing high, as a deepening bond selloff followed political developments that prolonged regional energy concerns.
Key US Treasury yields
| Security | Close | Change | Context |
|---|---|---|---|
| 2-year note | 4.926% | +6.5 bps | Traders ramped up bets that the Fed keeps rates higher for longer. |
| 10-year note | 5.241% | +6.1 bps | Hit an intraday peak of 5.272%; the highest close since 12 June 2007. |
| 20-year bond | 5.600% | +6.0 bps | Climbed from 5.54% in the previous session, well above its long-term average. |
| 30-year bond | 5.561% | +7.1 bps | A 24-year high, as longer-dated bonds bore the brunt of geopolitical risk premiums. |
Market-moving catalysts
- Fed rate path: Strong economic indicators paired with fresh energy shocks pushed the market-implied odds of an October Federal Reserve hike past 70%.
- Competition for capital: Hyperscaler AI infrastructure spending pushed borrowing benchmarks higher, draining equity market liquidity.
- Debt burden: Anxiety over federal spending and corporate financing needs has forced a structural premium into long-duration bonds.
Europe
Figures as at · Closing levels and yields for 28 September 2026, as reported in this brief
European stock markets closed mixed but largely flat. A rally in British homebuilders countered pressure from multi-year high sovereign bond yields and surging Brent crude.
Major European indices
| Index | Close | Change |
|---|---|---|
| STOXX Europe 600 | 638.68 | +0.01% (+0.03) |
| FTSE 100 (UK) | 10,684.88 | -0.10% (-10.37) |
| DAX (Germany) | 25,374.42 | -0.13% (-34.22) |
| CAC 40 (France) | 8,078.48 | +0.01% (+0.68) |
| IBEX 35 (Spain) | — | -0.50% |
Key drivers
- British homebuilders skyrocket: The UK government announced a major incentive scheme for first-time buyers. Persimmon rose nearly 15%, Barratt Redrow 12% and Taylor Wimpey 11.5%, lifting the FTSE 250 up 0.31%.
- Energy headwinds: Brent shot up toward $108.83 a barrel intraday after the Hormuz rejection, lifting energy stocks but deepening inflation worries.
- Sovereign debt selloff: Rising energy costs reinforced higher-for-longer rate narratives, driving regional yields up and capping high-valuation equities.
- Mining drag: A stronger dollar hit dollar-denominated metals. Fresnillo dropped 5.1% and Endeavour Mining 4.4% as gold fell.
Benchmark 10-year bond yields
- United Kingdom: 5.422% (+5.0 bps) — higher as debt markets factored in the new government’s upcoming budget planning.
- France: 4.776% (+5.0 bps) — an 18-year high on budget gridlock. The spread over Bunds exceeded 110 bps, the widest since the 2012 eurozone crisis.
- Italy: 4.590% (+5.0 bps) — a three-year peak, touching 4.60% intraday.
- Germany: 3.630% (+1.8 bps) — around its highest level since June 2009, a seventh consecutive weekly advance.
- Spain: 4.149% — rose with southern European peripheral debt, dragging bank stocks lower.
Commodities
- Dutch TTF natural gas: €73.77 per megawatt-hour, a multi-year high, on Hormuz shipping bottlenecks and unplanned maintenance at Norway’s Troll field.
- EU retail diesel: A record consumption-weighted average of €2.23 per litre, squeezing freight and logistics.
- API2 Rotterdam coal: $146.00 per ton as power grids switched from costly gas back to coal.
- ICE Paris rapeseed: Down 2.1% at €536.50 per ton.
Asia
Figures as at · Closing levels and yields for 28 September 2026, as reported in this brief
Asian equity markets closed mixed but leaned heavily lower, dominated by selling in Chinese and South Korean tech on new US data centre restrictions, while rising global yields and energy fears triggered capital outflows.
Major Asian index closings
| Index | Close | Change | Core driver |
|---|---|---|---|
| Kospi (South Korea) | 6,889.74 | -2.70% | Worst performer in the region; tech and semiconductor heavyweights plummeted on trade restrictions. |
| CSI 300 (China) | 4,340.76 | -2.22% | Pinned near a one-year low as sentiment plagued technology components. |
| Shanghai Composite | 3,823.62 | -1.67% | Dropped amid thin holiday volumes and tech data centre bottlenecks. |
| Nikkei 225 (Japan) | 65,877.62 | -0.73% | Snapped a six-day winning streak on corporate scandals and fears of a Bank of Japan hawkish pivot. |
| Hang Seng (Hong Kong) | 24,642.51 | +0.54% | Bucked the regional tech rout, supported by property flows. |
| S&P/ASX 200 (Australia) | 8,679.70 | +0.17% | Crept higher as resource and mining proxies absorbed energy spikes. |
Key drivers
- US data centre restrictions: Chinese and South Korean technology indices suffered heavy liquidations on reports that the US is expanding restrictions to ban Chinese components from global data centres.
- Corporate headwinds: The Nikkei faced selling on accounting scandals, while Hong Kong-listed Shein fell 11.7% after disclosing a 67% drop in quarterly adjusted net profit.
- Hong Kong property defiance: The Mainland Properties Index jumped 2.4% as stabilising residential prices triggered short-covering. NetEase rose 4.9%.
- Slowing mainland profits: China’s industrial profit growth slowed further in August; stagnation in domestic consumer demand pulled Shanghai down over 1.7%.
Benchmark 10-year yields
- Australia: 5.435% (+5.0 bps) — a 15-year high ahead of the RBA decision.
- South Korea: 4.539% (+14.7 bps) — a four-year peak. The 3-year KTB rose 11.3 bps to 4.119%, its highest since late 2022.
- Japan: 3.090% (+0.5 bps) — near its 30-year high of 3.115%. The 2-year JGB closed at 1.975%, its highest since 1995.
- China: 1.670%, flat — near 2025 structural lows.
Commodities
- Brent crude: Jumped roughly 1.6% to settle near $99.01 on Asian desks, later striking a peak near $106.50 in Western sessions.
- Spot gold: Plunged 2.1% to $4,231.90 on Asian desks before collapsing further to a seven-week low of $4,136.81 overnight.
- Iron ore: Dalian futures fell under the $100 mark to ¥705 per ton as Chinese port stockpiles built and the steel association warned mills to cut output.
- Malaysian palm oil: 4,664 MYR per tonne (-0.17%). TOCOM rubber edged up 0.87% to 256.20 US cents per kg.
Commodities
Figures as at · Settlement prices for 28 September 2026, as reported in this brief
Commodities were extremely volatile. Energy rallied sharply after geopolitical developments disrupted Middle East supply expectations, while a stronger dollar and soaring Treasury yields applied heavy selling pressure to precious metals.
Energy and metals
- Brent crude: $105.28 per barrel (+0.9%). Prices briefly pared gains on signals of a US–Iran dialogue, then rebounded after Saudi Arabia resumed exports via its East–West pipeline, down since a 10 September drone strike.
- WTI crude: $92.60 per barrel (+0.2%), stabilising near multi-month highs.
- Spot gold: $4,159.67 per ounce (-3.14%), with a seven-week low of $4,136.81. The surge in competing 10-year yields damaged the appeal of non-yielding assets.
- Silver: $62.12 per ounce (-4.1%), underperforming as industrial demand fears met monetary headwinds.
- Copper: Gained 1.5% on tight physical warehouse inventories.
What moved the market
- Rejection of the Hormuz truce: President Trump rejected a seven-day ceasefire and reopening proposal from Iran, reinjecting a steep risk premium into energy. Brent spiked above $106 intraday before settling at $105.28.
- The macro squeeze on metals: The oil escalation ignited sticky-inflation fears, forcing US yields higher and strengthening the dollar. Non-yielding assets bore the brunt as investors recalibrated for higher-for-longer rates.
- The US–China tariff framework: A $30 billion reciprocal tariff relief framework restored roughly 90% of covered goods to standard trade status, but commercial soybeans were explicitly excluded — only seed beans were included — so soybean futures tumbled while corn and wheat found modest support.
Africa
Figures as at · Levels for Monday 28 September 2026, as reported in this brief
African equity and currency markets swung sharply in both directions. An energy-driven macro shock pushed the rand lower, while localised catalysts sparked a record listing push in Kenya and multi-year valuation highs in Nigeria.
Major African markets
| Market | Benchmark | Level | Movement |
|---|---|---|---|
| Kenya | NSE All Share Index (NASI) | 248.51 | +4.15% on the week |
| South Africa | USD / ZAR | 16.40 | -0.51% on the day |
| Nigeria | NGX All-Share Index | 252,113.41 | +62.01% year to date |
| Ethiopia | ESX Capital Market | 7 listed companies | Expansion |
Currencies
- USD/ZAR: 16.40 (-0.51%) — under pressure from the global risk-off mood.
- USD/NGN: 1,327.03 (+6.2% in September) — stronger, supported by CBN rate interventions.
- USD/EGP: 52.10 (-2.58%) — impacted by regional energy import stresses.
- USD/GHS: 11.64, flat (-11.1% year to date) — consolidating near structural support.
Regional drivers
- The NSE leads Africa’s recovery: The Nairobi Securities Exchange staged a 4.15% recovery, regaining KSh 166.08 billion in market capitalisation, after Quickmart announced it is preparing to list — the bourse’s first major private equity exit via a public listing.
- Nigeria on a FTSE upgrade and rate cuts: The NGX held above 250,000 points for a 62.01% year-to-date return, after Nigeria’s return to the FTSE Russell Frontier Market index and a 350 basis point rate cut to 23% by the Central Bank of Nigeria.
- Frontier debt index adjustments: JPMorgan is preparing to launch its local-currency frontier bond index, with Africa capturing a 45% aggregate weighting.
East Africa
Figures as at · Levels for Monday 28 September 2026, as reported in this brief
East African markets rallied sharply, decoupling from the global equity selloff, led by a multi-billion shilling recovery on the NSE. Macro headwinds persist across cross-border freight routes on inter-county tariff disputes.
Major East African indicators
| Exchange / metric | Level | Movement | Context |
|---|---|---|---|
| NSE All-Share Index (NASI) | 248.51 | +4.15% on the week | Kenyan stocks erased a two-week rout, recovering KSh 166.08 billion in market cap. |
| Uganda USE / Tanzania DSE | Flat / positive | +4.01% / +1.74% on the week | Regional indices followed the bullish Kenyan momentum. |
| Secondary bond markets | Turnover doubled | +104% | Institutional appetite for domestic fixed income continues to drain banking stock liquidity. |
Business highlights
- The KSh 2.2 trillion Lamu refinery conflict: Aliko Dangote’s 700,000 barrel-per-day East African Oil Refinery has begun construction in Lamu, after a Chinese vessel arrived with 3,000 metric tons of materials. A group of 133 local residents has filed an urgent lawsuit in the Environment and Land Court seeking to block it, claiming uncompensated displacement and destruction of property.
- Quickmart listing sparks retail euphoria: Quickmart Kenya announced formal entry onto the NSE’s Main Investment Market Segment. Sole owner Sokoni Retail Kenya is shedding a 50% equity stake.
- Northern Corridor bottlenecks: Trade bodies warned that proliferating county-level transit levies — cess, entry, offloading and branding fees — are behaving like internal trade tariffs on freight from Mombasa to Uganda, Rwanda and South Sudan, raising turnaround times and supply-chain costs.
Currencies
- USD/UGX: 3,914.86 (+0.04%). The Bank of Uganda held its benchmark rate at 9.75%.
- USD/TZS: 2,643.46 (+0.04%) — trading inside predictable quarterly margins.
- USD/RWF: 1,476.59 (-0.13%) — gained slight ground against the dollar.
- Ethiopian reform: Regional trade blocs are watching the Ethiopian birr as the National Bank of Ethiopia relaxes rigid FX controls.
Nairobi Securities Exchange
Figures as at · Nairobi Securities Exchange session data for 28 September 2026, as reported in this brief
The NSE benchmarks finished slightly lower on Monday, pulling back marginally after a 4.15% weekly rally that had made Kenya the top-performing equity market in Africa.
Major NSE indices
| Index | Level | Net session change |
|---|---|---|
| NSE All-Share Index (NASI) | 247.87 | -0.64 |
| NSE 20 Share Index | 4,348.25 | -15.42 |
| NSE 25 Share Index | 7,039.95 | -22.20 |
Turnover
- Equity turnover: KSh 328.35 million across 11.45 million traded shares.
- Market capitalisation: Around the KSh 4.16 trillion mark.
Corporate movers
- Top gainers: Express Kenya Plc (+9.92%), Nairobi Securities Exchange Plc itself (+8.1% to KSh 29.90) and BK Group Plc. Centum Investment (+4.71%) and I&M Holdings (+4.31%) also saw strong buying.
- Top decliners: Uchumi Supermarket Plc, Flame Tree Group, CIC Insurance, Crown Paints (-3.78% to KSh 57.25) and KenGen.
Primary market
- Quickmart IPO: Quickmart will launch its share offer on or around 30 September 2026 to list on the Main Investment Market Segment — the first major private equity exit via public listing in recent Kenyan history.
- Global investor pitching: NSE chief executive Frank Mwiti pitched regional growth plans to global funds at the Bullish Africa 2026 Annual Summit in New York.
Kenya Forex
Figures as at · Central Bank of Kenya official mean rates, 28 September 2026
The shilling traded steadily at 129.67 against the dollar on the CBK’s official print. Reserves of $15.04 billion leave it insulated from the emerging market volatility caused by the energy shock.
Official CBK mean rates, 28 September 2026
| Currency | Code | Official CBK mean rate |
|---|---|---|
| US Dollar | USD | 129.6700 |
| Sterling Pound | GBP | 171.7400 |
| Euro | EUR | 147.6500 |
| Chinese Yuan | CNY | 19.3100 |
| South African Rand | ZAR | 7.9200 |
| Indian Rupee | INR | 1.3500 |
Cross-border rates for 1 KES
- Uganda: 30.1900 UGX. Tanzania: 20.3900 TZS. Rwanda: 11.3600 RWF. Burundi: 23.1000 BIF.
What is holding the shilling
- Reserve cushion: Reserves of $15.04 billion give the CBK room to clear seasonal demand from petroleum and machinery importers.
- Diaspora remittances: High-volume inflows continue to match or exceed historical baselines, keeping a steady supply of dollars in local banks.
- Commercial spread: While the official interbank rate anchors at 129.67, retail selling rates at banks and bureaux typically sit between 130.10 and 130.60.
Real Estate
Kenya’s property market has shifted into a selective, data-driven phase, marked by a rise in single-family land values alongside structural regulatory adjustments from city councils.
Segment performance
| Segment | Trend | Yield focus | Primary hubs |
|---|---|---|---|
| Affordable & mid-market | Dominating absorption, focused on the KSh 2m to KSh 8m bracket. | 5.5%–7.8% stable yields | Riruta, Ruaka and commuter nodes |
| Satellite land | Outperforming equity bourses in long-term capital appreciation. | High long-term valuation flips | Ruiru, Juja, Kitengela, Syokimau |
| Premium office space | Flight to quality; prime Grade-A occupancy consolidated at 80.3%. | Selective commercial streams | Westlands, Upper Hill, Gigiri |
Headlines
- Nairobi River Corridor rezoning: Governor Johnson Sakaja announced the Nairobi River Corridor Special Planning Area. The master layout restructures land use along the riparian path to manage flood hazards and clears the zone for social and affordable housing.
- Standalone homes outpace apartments: The KNBS residential property price index shows average standalone house prices up 8.5% while apartment valuations fell 3% on selective demand and pockets of oversupply.
- The Kahawa Sukari land boom: Plots in the Kahawa Sukari and Membley corridors have passed KSh 15 million, triggering clashes between welfare associations and developers over single-family zoning.
- Mass coastline title issuance: President William Ruto led the distribution of over 94,000 formal title deeds across Kwale and coastal counties, aiming to unlock dormant land values.
Red flags
- Double-digit mortgage strains: Despite the CBK holding its benchmark rate, retail home loans remain restricted by double-digit commercial interest rates, locking out much of the middle class and pushing the market toward cash or off-plan escrow structures.
- Rising commercial defaults: Banking surveys show lenders bracing for a spike in real-estate non-performing loans, and scaling back construction credit lines in response.
Kenya Snapshot
Every figure below carries the date it describes and who published it. Where this brief did not restate a value, the figure Serrari already publishes is carried over with its own effective date — it is never re-dated to today. Most recent figure in this snapshot: .
Macro
Inflation
6.6%
Year-on-year headline CPI.
As at
KNBS CPI, Aug 2026 — carried over from Serrari's published macro dataGDP growth
5.3%
Real GDP, year-on-year. Not restated in this brief.
As at
KNBS quarterly GDP (owner, 2026-09-14), Q1 2026 — carried over from Serrari's published macro dataForeign exchange reserves
$15.04bn
The East Africa section of the same brief cites $14.9bn; this is the Kenya section’s figure.
As at
Central Bank of Kenya, as reported in this brief
Foreign exchange
USD / KES
129.67
Official CBK print. Retail selling rates sit between 130.10 and 130.60.
As at
Central Bank of Kenya official mean rateGBP / KES
171.74
As at
Central Bank of Kenya official mean rateEUR / KES
147.65
As at
Central Bank of Kenya official mean rate
Equities
NSE All-Share (NASI)
247.87
-0.64 on the session, after a 4.15% weekly rally
As at
Nairobi Securities Exchange, as reported in this briefNSE 20-Share
4,348.25
-15.42
As at
Nairobi Securities Exchange, as reported in this briefNSE 25-Share
7,039.95
-22.20
As at
Nairobi Securities Exchange, as reported in this briefMarket capitalisation
KSh 4.16tn
Recovered KSh 166.08 billion over the week
As at
Nairobi Securities Exchange, as reported in this briefEquity turnover
KSh 328.35m
11.45m shares traded
As at
Nairobi Securities Exchange, as reported in this brief
Rates
Central Bank Rate
8.75%
Held. Retail mortgages stay in double digits regardless.
As at
Central Bank of Kenya — Monetary Policy Committee, as published on this brief’s artwork
At a glance
- 1The US 10-year closing at 5.241% is the highest since June 2007. That one number explains the equity selloff, gold’s 3.14% drop and the sovereign bond rout from London to Seoul.
- 2The NSE was Africa’s best equity market last week, recovering KSh 166.08 billion of market capitalisation, before easing back 0.64 points on Monday.
- 3CBK’s official print held the shilling at 129.67 with reserves at $15.04 billion, leaving it among the steadiest currencies in Sub-Saharan Africa.
Sources
- Serrari Group desk compilation, 29 September 2026
- Central Bank of Kenya — official exchange rates
- Nairobi Securities Exchange — daily market statistics
- Serrari published Africa macro data