
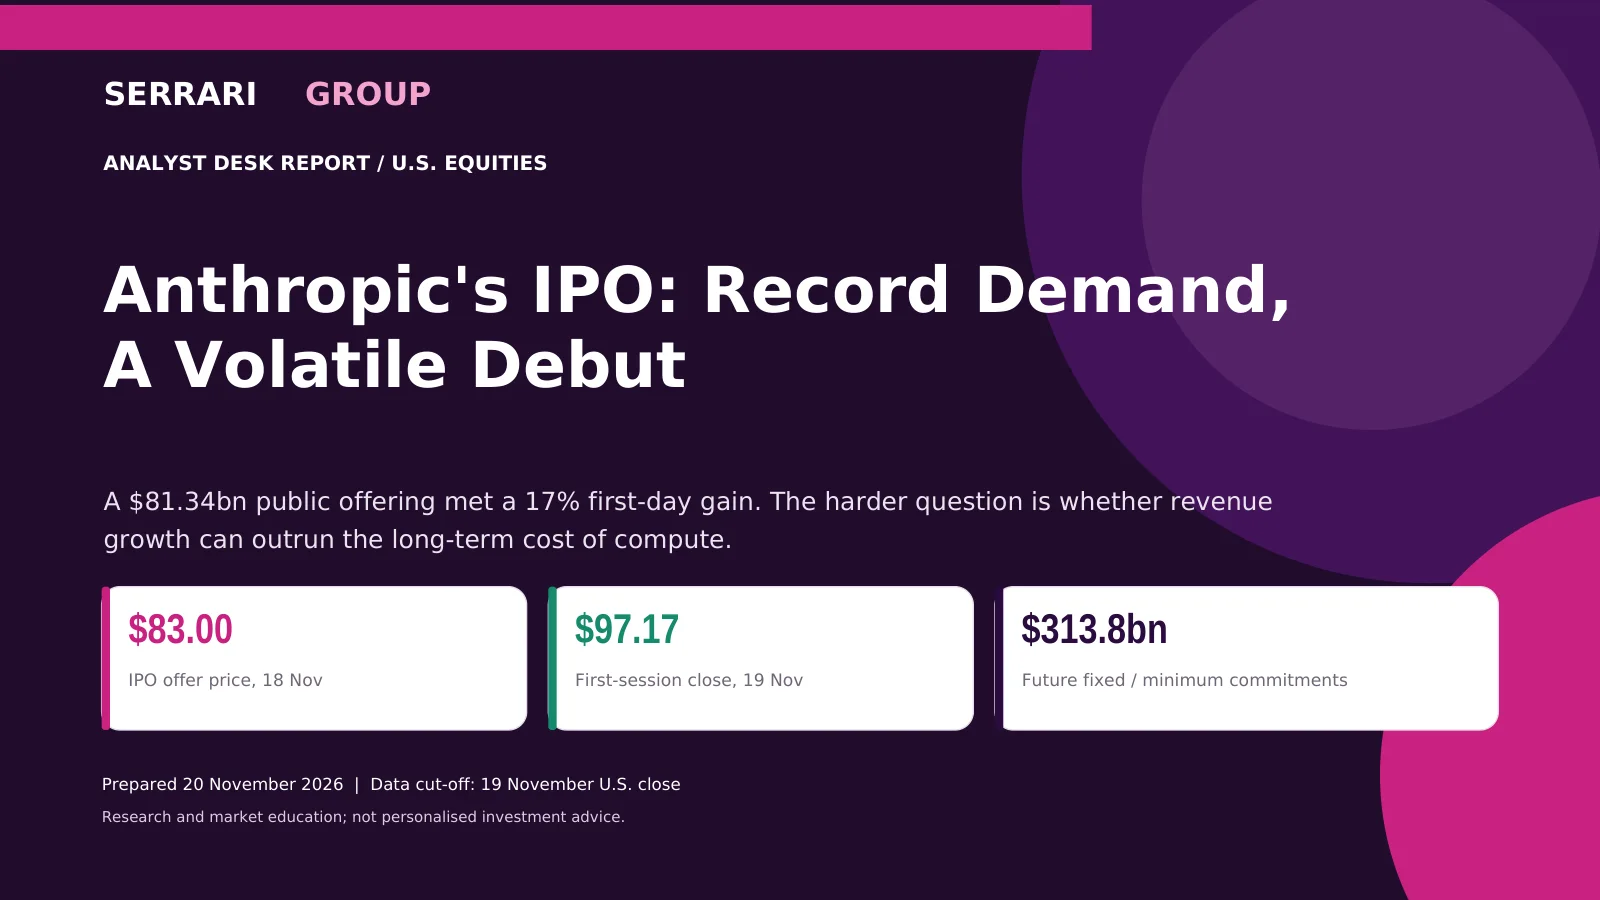
Anthropic's IPO: Record Demand, A Volatile Debut
A $81.34bn public offering met a 17% first-day gain. The harder question is whether revenue growth can outrun the long-term cost of compute · Post-IPO Analysis · Data cut-off 19 November U.S. close
Anthropic priced 980m Class A shares at $83.00, opened at $111.50 and closed its first session at $97.17 — a 17.1% offer-to-close gain after a 12.9% open-to-close slide. The desk works through the offer mechanics, the $1.285tn basic capitalization, 56.6% compute intensity and the $313.8bn commitment stack now facing a public valuation test.
Anthropic's IPO: Record Demand, A Volatile Debut
SERRARI GROUP — ANALYST DESK REPORT / U.S. EQUITIES
A $81.34bn public offering met a 17% first-day gain. The harder question is whether revenue growth can outrun the long-term cost of compute.
$83.00 — IPO offer price, 18 Nov
$97.17 — First-session close, 19 Nov
$313.8bn — Future fixed / minimum commitments
Prepared 20 November 2026 | Data cut-off: 19 November U.S. close
Research and market education; not personalised investment advice.
Executive take
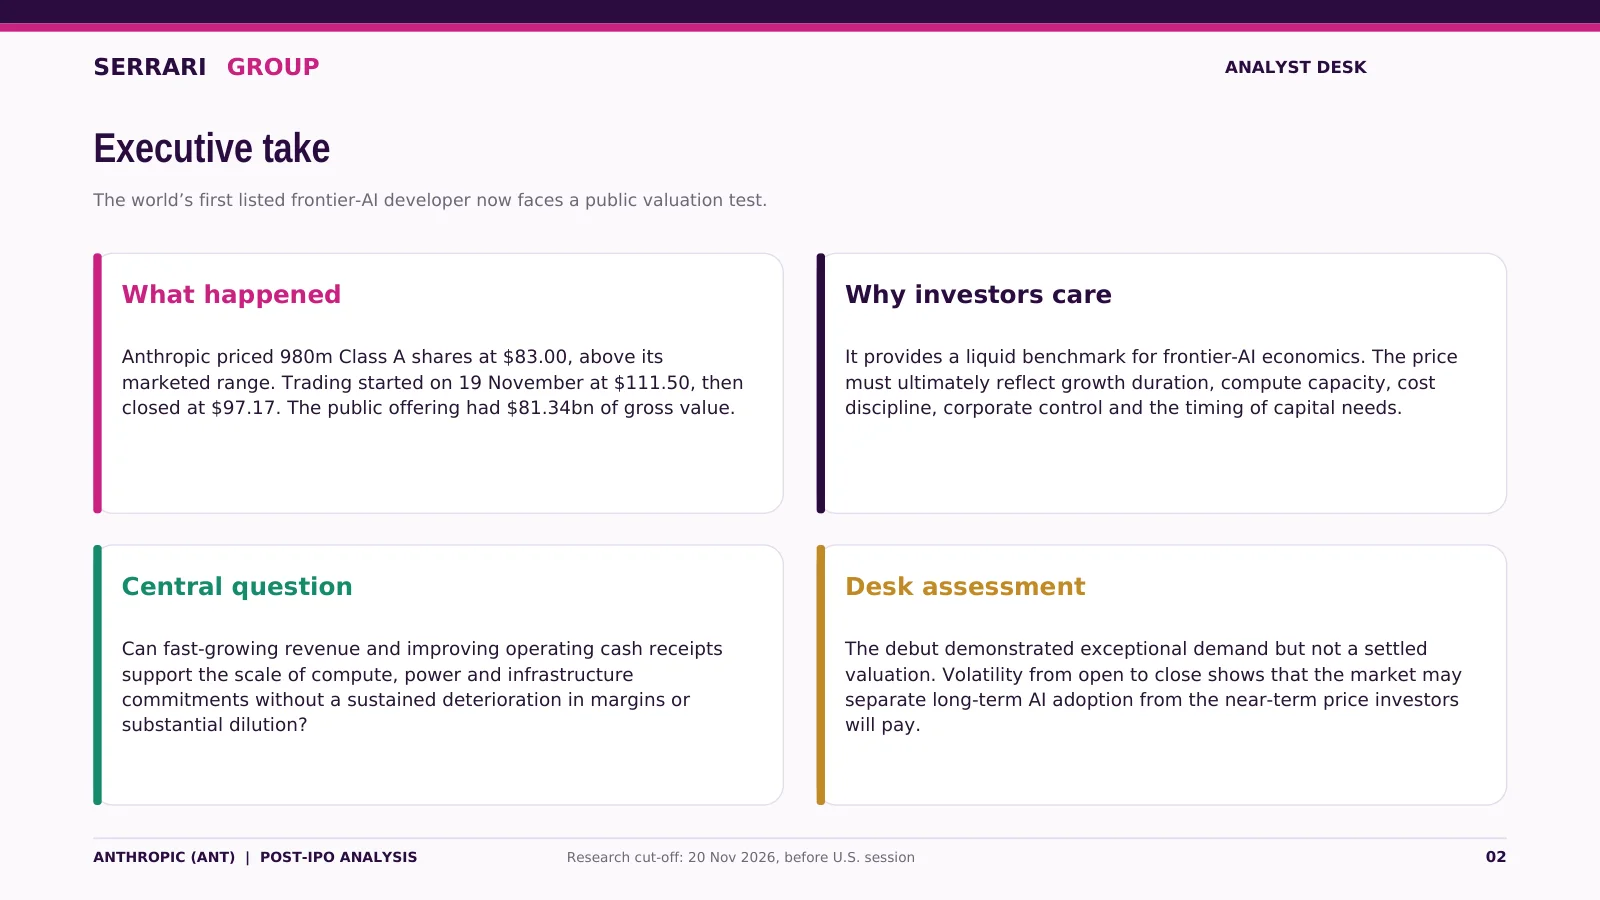
The world's first listed frontier-AI developer now faces a public valuation test.
What happened
Anthropic priced 980m Class A shares at $83.00, above its marketed range. Trading started on 19 November at $111.50, then closed at $97.17. The public offering had $81.34bn of gross value.
Why investors care
It provides a liquid benchmark for frontier-AI economics. The price must ultimately reflect growth duration, compute capacity, cost discipline, corporate control and the timing of capital needs.
Central question
Can fast-growing revenue and improving operating cash receipts support the scale of compute, power and infrastructure commitments without a sustained deterioration in margins or substantial dilution?
Desk assessment
The debut demonstrated exceptional demand but not a settled valuation. Volatility from open to close shows that the market may separate long-term AI adoption from the near-term price investors will pay.
The debut: strength and sharp intraday repricing
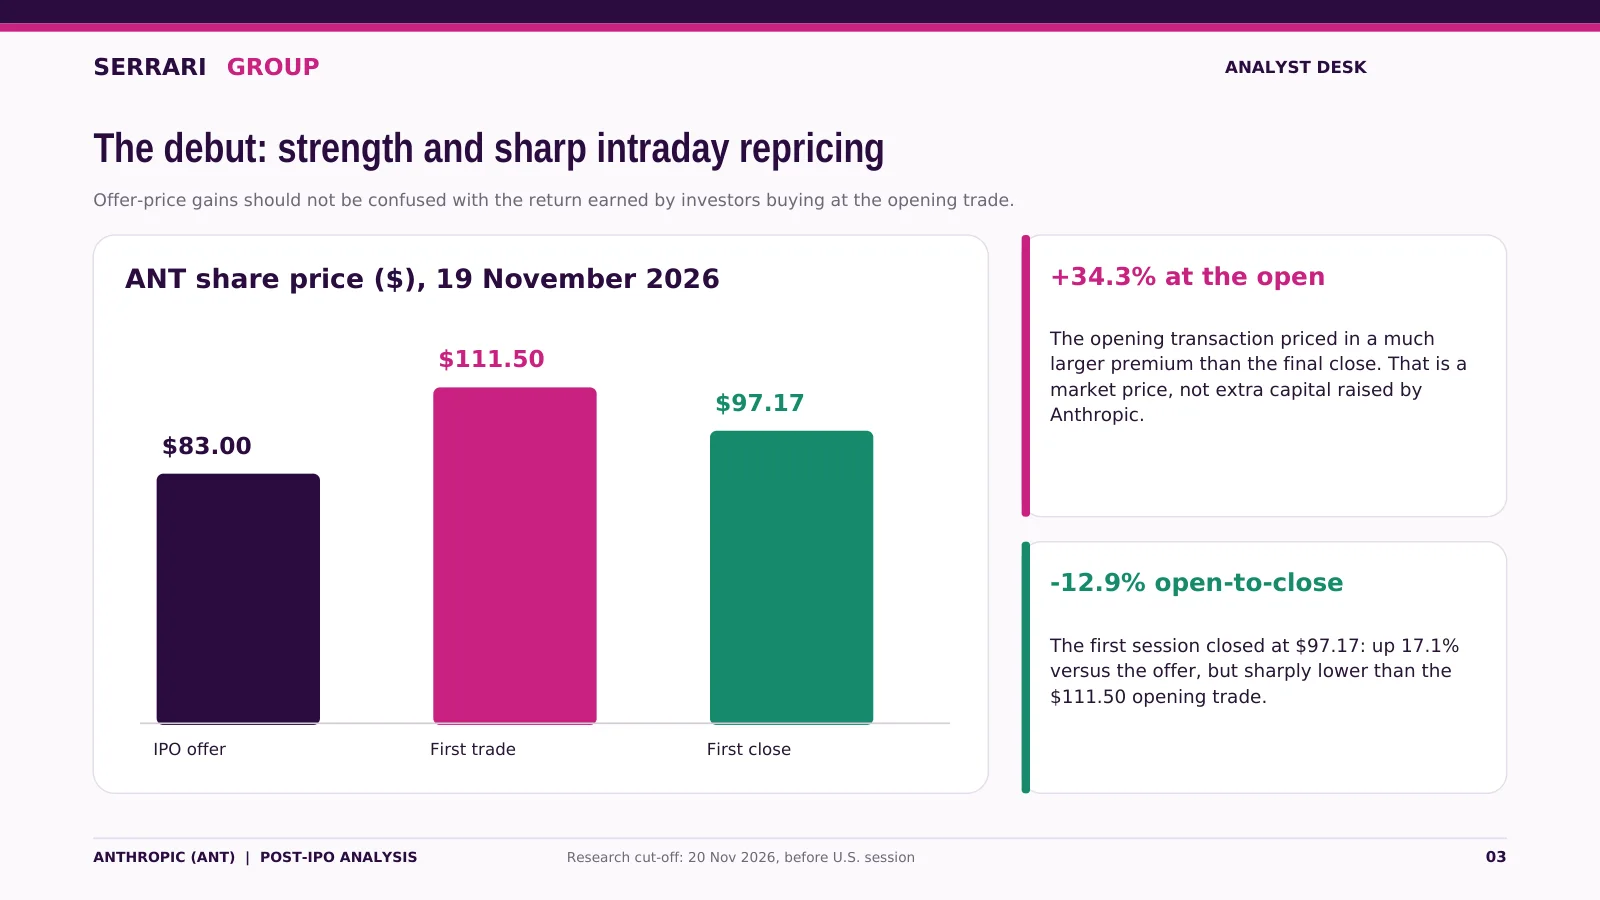
Offer-price gains should not be confused with the return earned by investors buying at the opening trade.
ANT share price ($), 19 November 2026
IPO offer: $83.00 · First trade: $111.50 · First close: $97.17
+34.3% at the open
The opening transaction priced in a much larger premium than the final close. That is a market price, not extra capital raised by Anthropic.
-12.9% open-to-close
The first session closed at $97.17: up 17.1% versus the offer, but sharply lower than the $111.50 opening trade.
Offer mechanics: public float, private capital
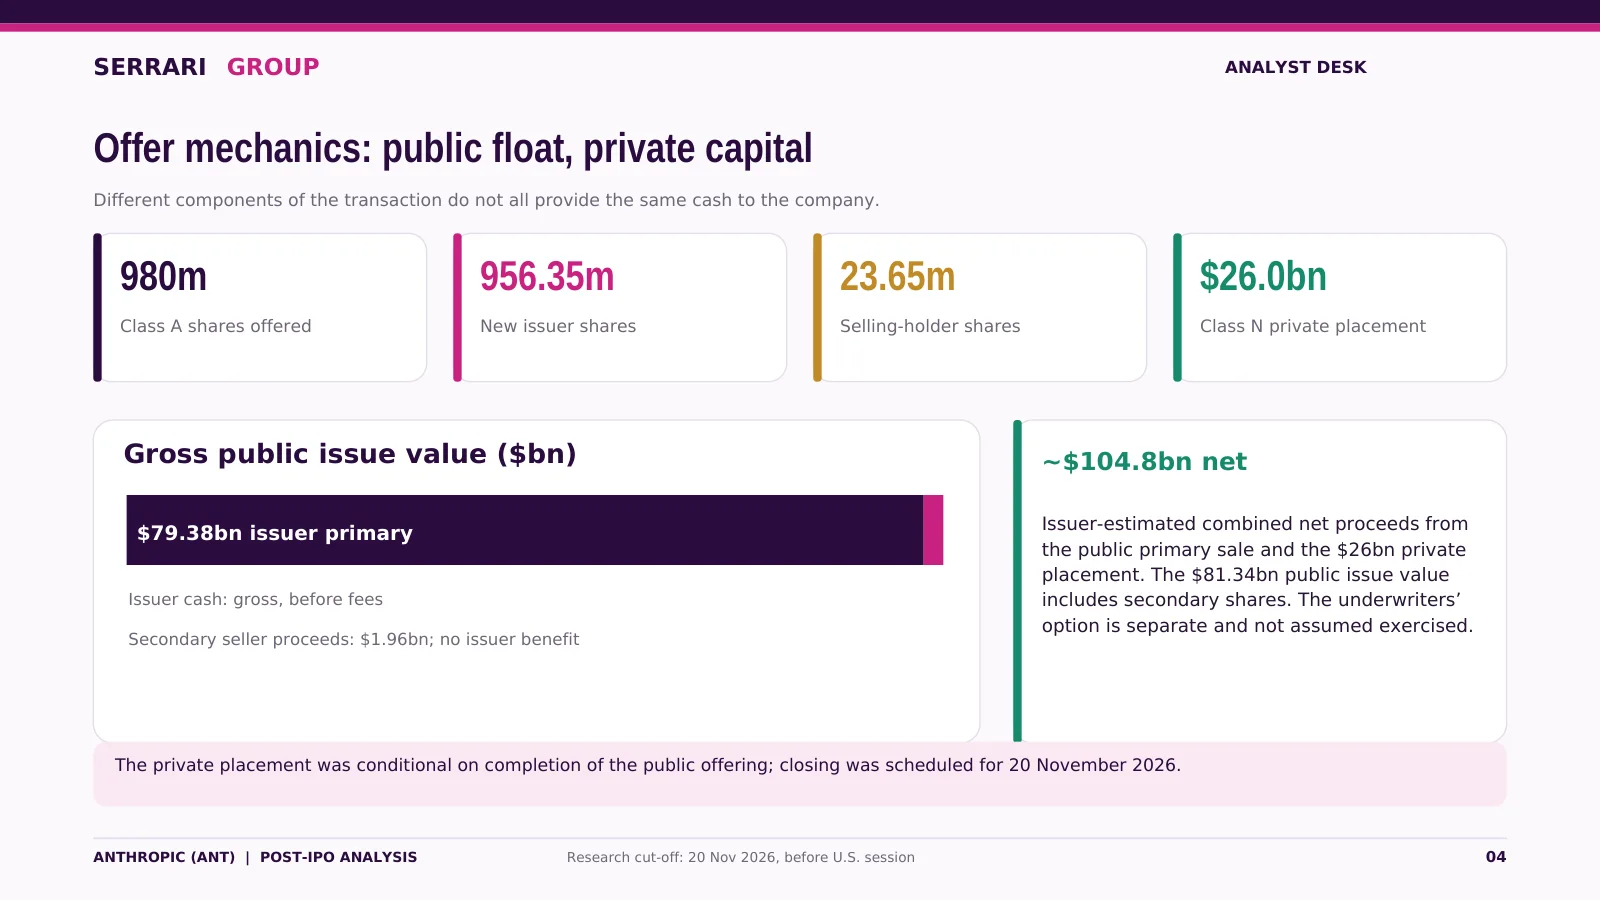
Different components of the transaction do not all provide the same cash to the company.
980m — Class A shares offered
956.35m — New issuer shares
23.65m — Selling-holder shares
$26.0bn — Class N private placement
Gross public issue value ($bn)
$79.38bn issuer primary — issuer cash: gross, before fees. Secondary seller proceeds: $1.96bn; no issuer benefit.
~$104.8bn net
Issuer-estimated combined net proceeds from the public primary sale and the $26bn private placement. The $81.34bn public issue value includes secondary shares. The underwriters' option is separate and not assumed exercised.
The private placement was conditional on completion of the public offering; closing was scheduled for 20 November 2026.
Valuation: specify the share-count basis
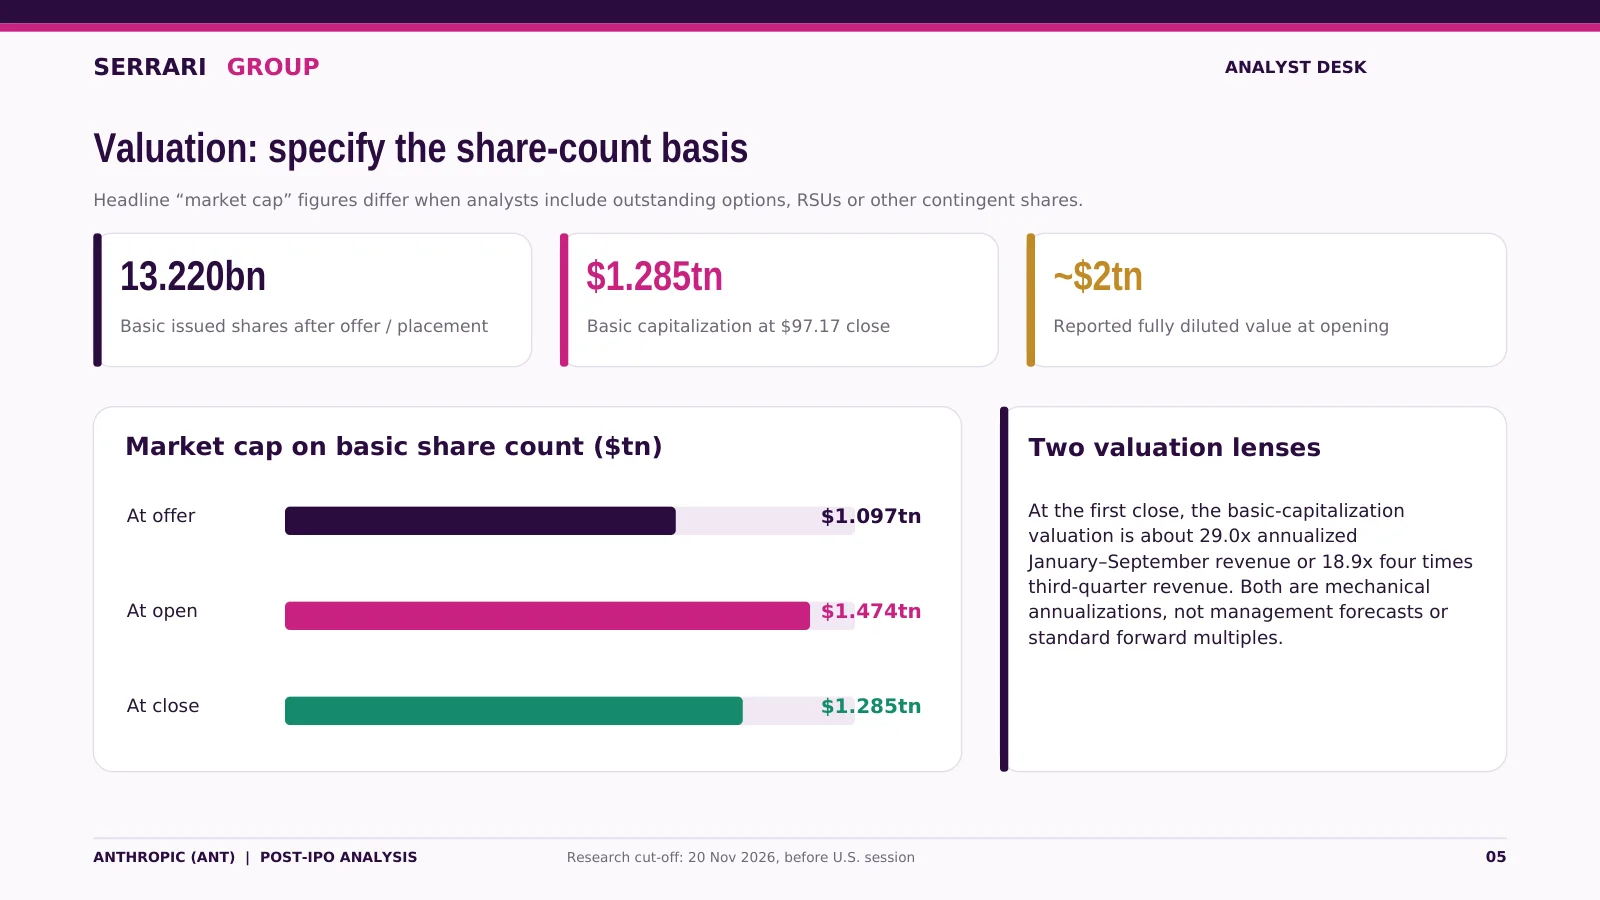
Headline "market cap" figures differ when analysts include outstanding options, RSUs or other contingent shares.
13.220bn — Basic issued shares after offer / placement
$1.285tn — Basic capitalization at $97.17 close
~$2tn — Reported fully diluted value at opening
Market cap on basic share count ($tn)
At offer: $1.097tn · At open: $1.474tn · At close: $1.285tn
Two valuation lenses
At the first close, the basic-capitalization valuation is about 29.0x annualized January–September revenue or 18.9x four times third-quarter revenue. Both are mechanical annualizations, not management forecasts or standard forward multiples.
Revenue acceleration: exceptional, but not yet normalized
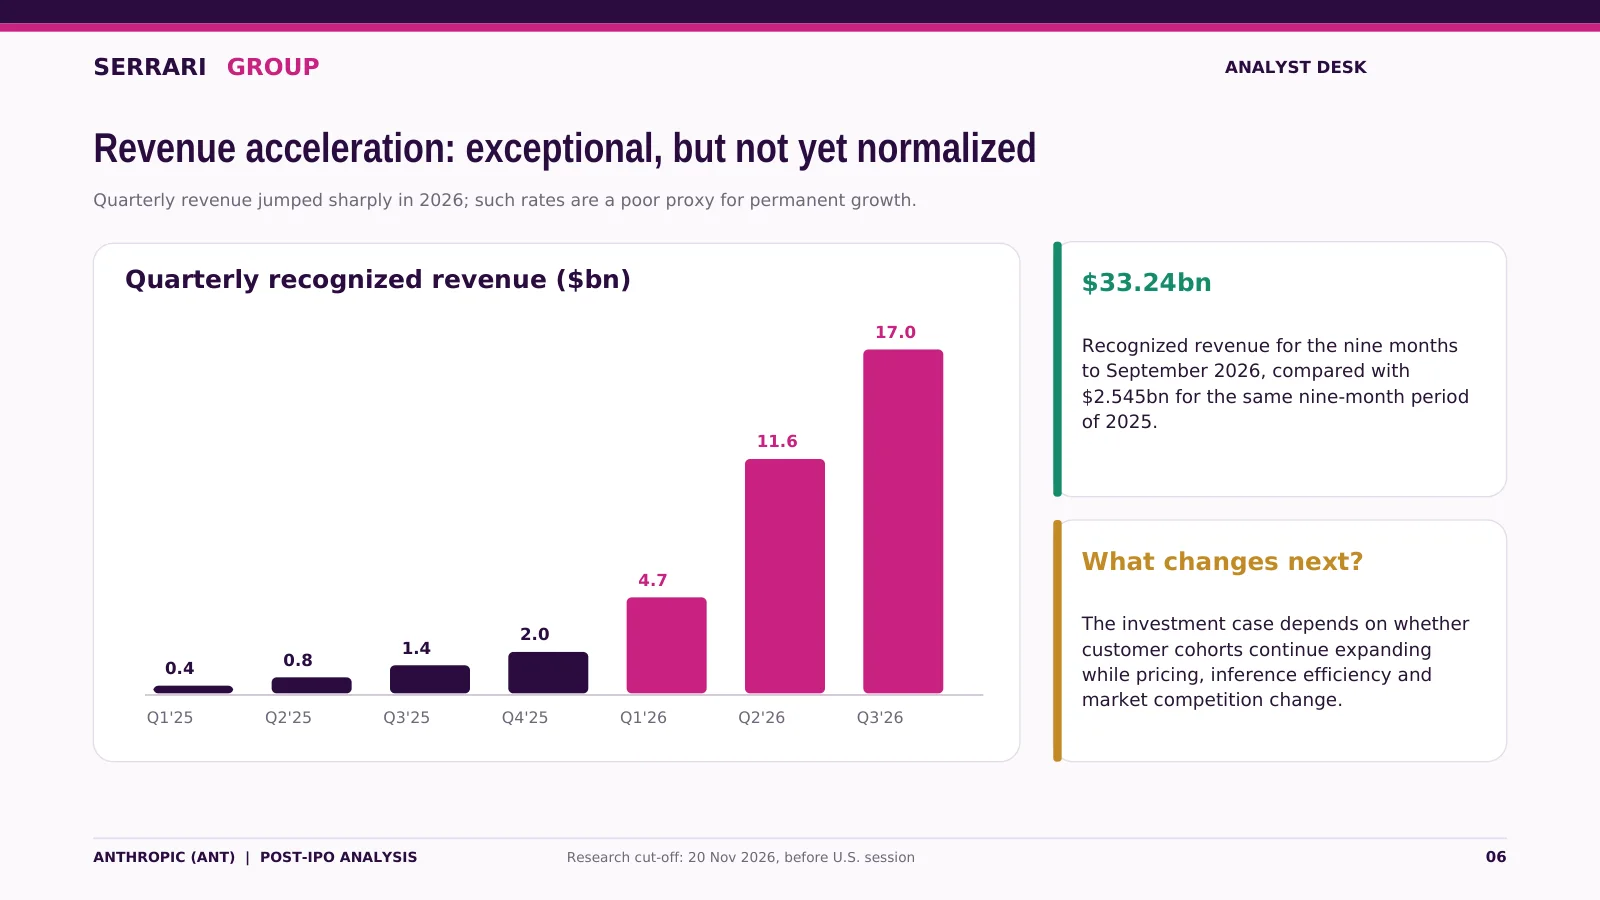
Quarterly revenue jumped sharply in 2026; such rates are a poor proxy for permanent growth.
Quarterly recognized revenue ($bn)
Q1'25: 0.4 · Q2'25: 0.8 · Q3'25: 1.4 · Q4'25: 2.0 · Q1'26: 4.7 · Q2'26: 11.6 · Q3'26: 17.0
$33.24bn
Recognized revenue for the nine months to September 2026, compared with $2.545bn for the same nine-month period of 2025.
What changes next?
The investment case depends on whether customer cohorts continue expanding while pricing, inference efficiency and market competition change.
Operating economics: compute remains the hinge
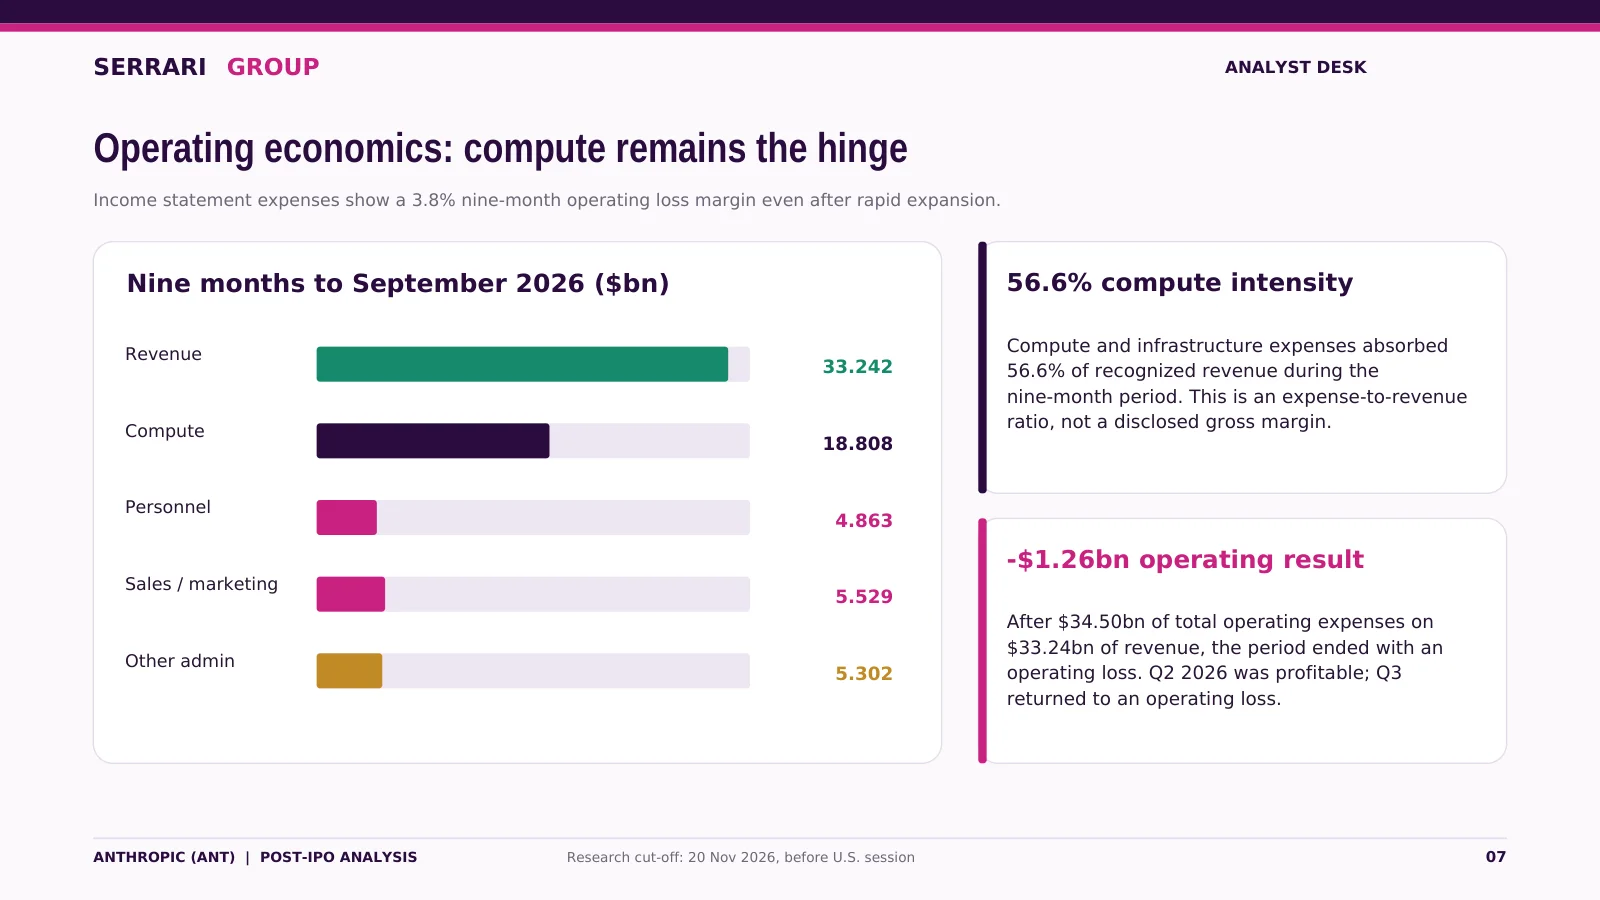
Income statement expenses show a 3.8% nine-month operating loss margin even after rapid expansion.
Nine months to September 2026 ($bn)
Revenue: 33.242 · Compute: 18.808 · Personnel: 4.863 · Sales / marketing: 5.529 · Other admin: 5.302
56.6% compute intensity
Compute and infrastructure expenses absorbed 56.6% of recognized revenue during the nine-month period. This is an expense-to-revenue ratio, not a disclosed gross margin.
-$1.26bn operating result
After $34.50bn of total operating expenses on $33.24bn of revenue, the period ended with an operating loss. Q2 2026 was profitable; Q3 returned to an operating loss.
Net loss is not a cash-burn estimate
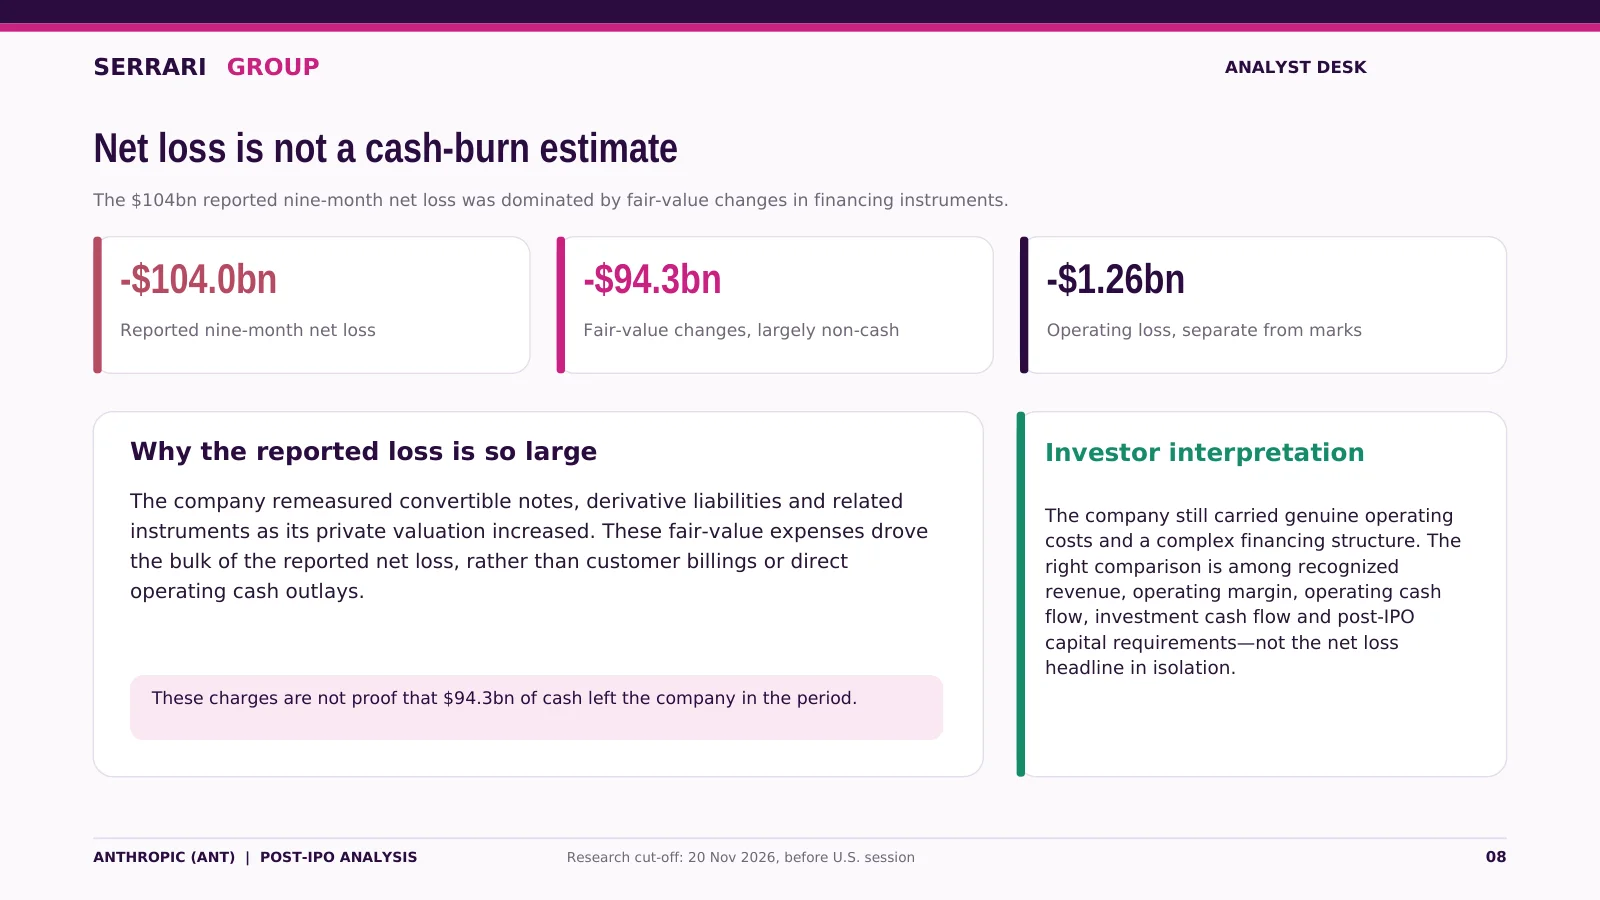
The $104bn reported nine-month net loss was dominated by fair-value changes in financing instruments.
-$104.0bn — Reported nine-month net loss
-$94.3bn — Fair-value changes, largely non-cash
-$1.26bn — Operating loss, separate from marks
Why the reported loss is so large
The company remeasured convertible notes, derivative liabilities and related instruments as its private valuation increased. These fair-value expenses drove the bulk of the reported net loss, rather than customer billings or direct operating cash outlays.
These charges are not proof that $94.3bn of cash left the company in the period.
Investor interpretation
The company still carried genuine operating costs and a complex financing structure. The right comparison is among recognized revenue, operating margin, operating cash flow, investment cash flow and post-IPO capital requirements—not the net loss headline in isolation.
Liquidity is substantial; obligations are larger
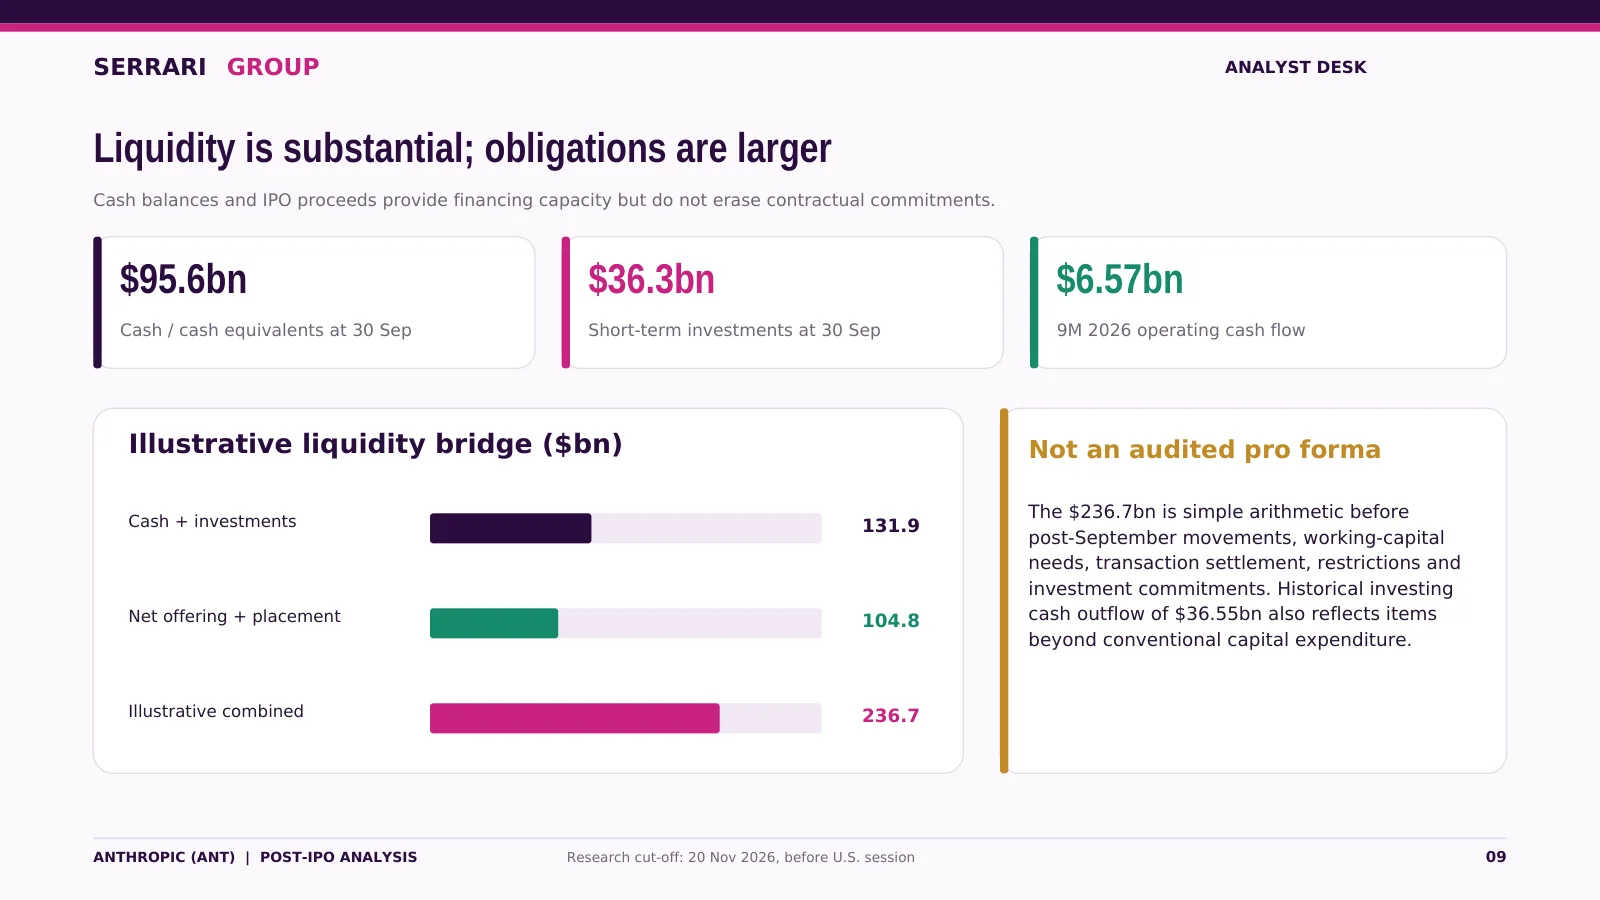
Cash balances and IPO proceeds provide financing capacity but do not erase contractual commitments.
$95.6bn — Cash / cash equivalents at 30 Sep
$36.3bn — Short-term investments at 30 Sep
$6.57bn — 9M 2026 operating cash flow
Illustrative liquidity bridge ($bn)
Cash + investments: 131.9 · Net offering + placement: 104.8 · Illustrative combined: 236.7
Not an audited pro forma
The $236.7bn is simple arithmetic before post-September movements, working-capital needs, transaction settlement, restrictions and investment commitments. Historical investing cash outflow of $36.55bn also reflects items beyond conventional capital expenditure.
The $313.8bn compute test
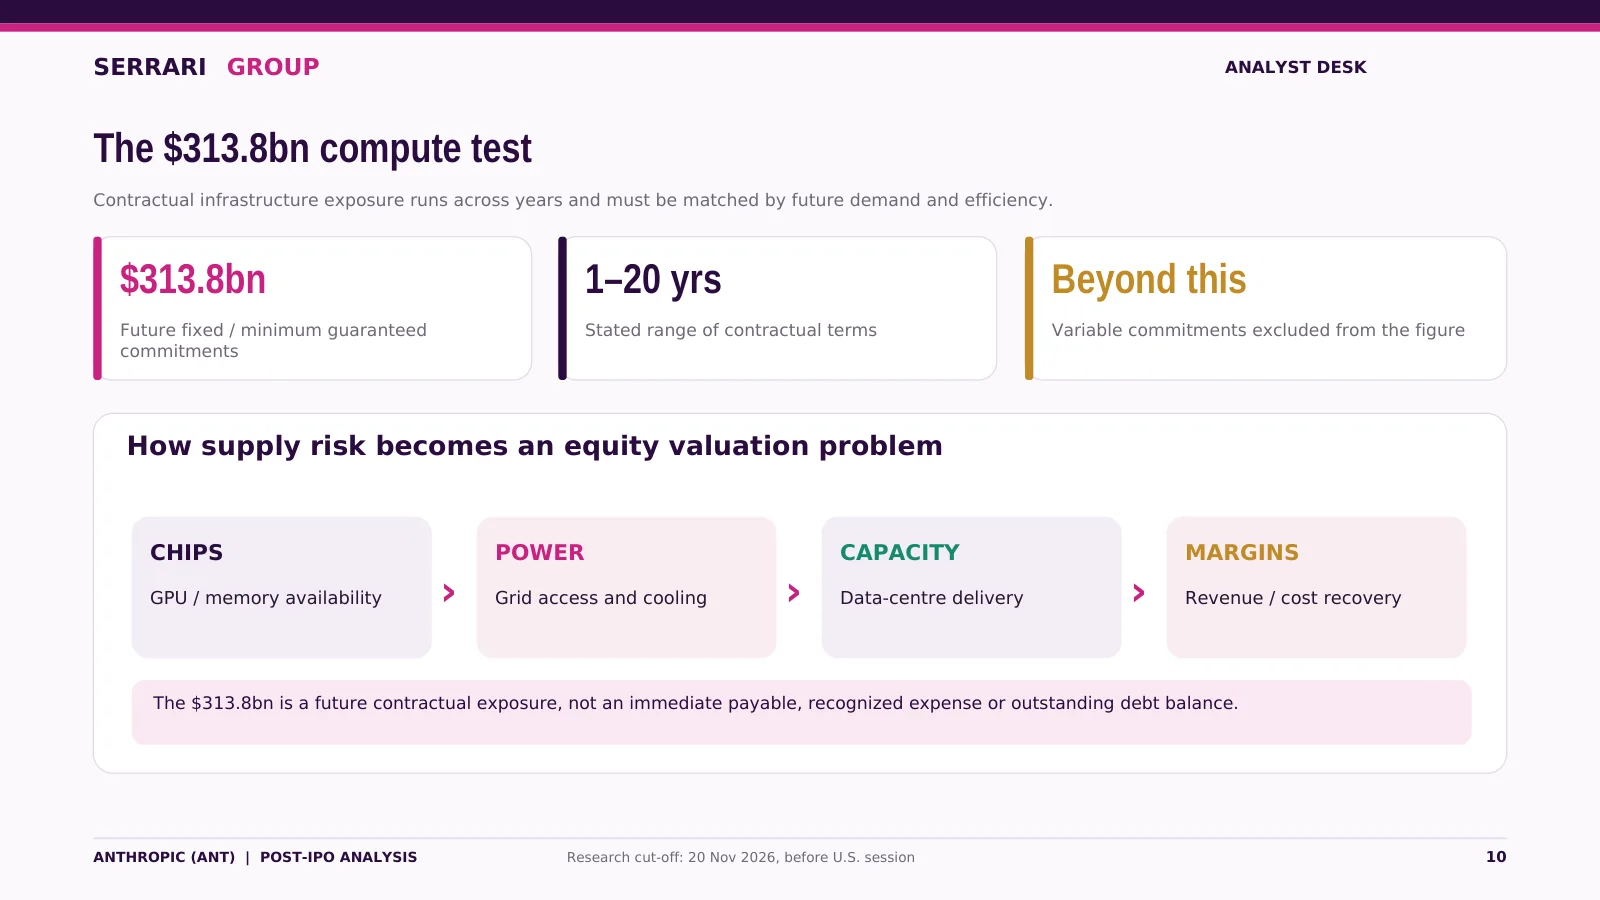
Contractual infrastructure exposure runs across years and must be matched by future demand and efficiency.
$313.8bn — Future fixed / minimum guaranteed commitments
1–20 yrs — Stated range of contractual terms
Beyond this — Variable commitments excluded from the figure
How supply risk becomes an equity valuation problem
CHIPS (GPU / memory availability) › POWER (Grid access and cooling) › CAPACITY (Data-centre delivery) › MARGINS (Revenue / cost recovery)
The $313.8bn is a future contractual exposure, not an immediate payable, recognized expense or outstanding debt balance.
Revenue mix and concentration
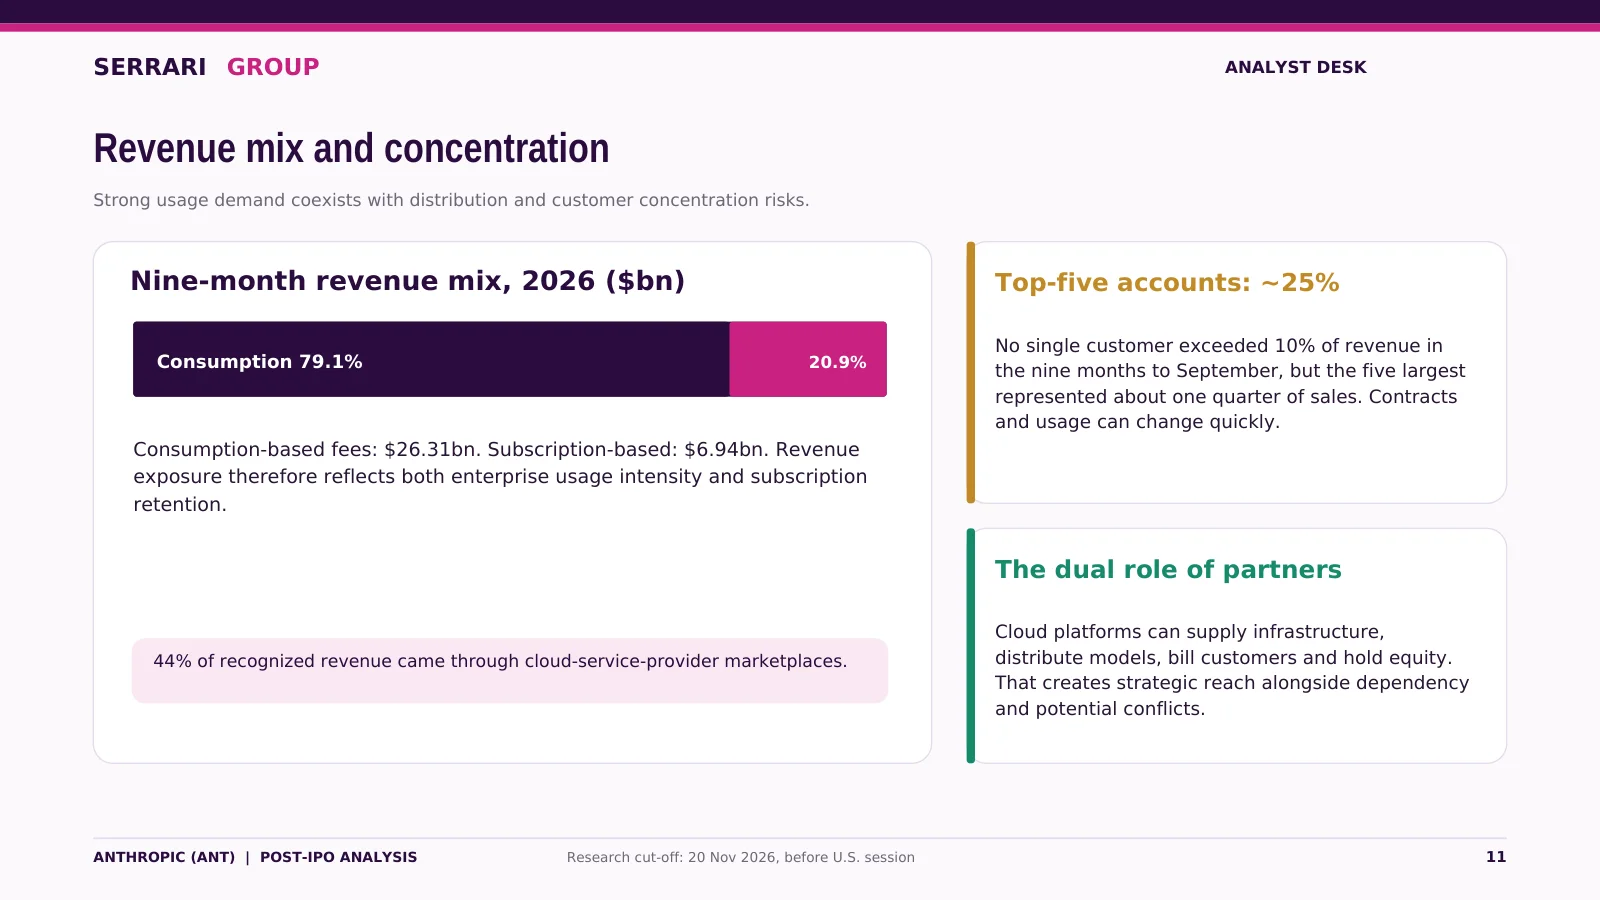
Strong usage demand coexists with distribution and customer concentration risks.
Nine-month revenue mix, 2026 ($bn)
Consumption 79.1% · Subscription 20.9%
Consumption-based fees: $26.31bn. Subscription-based: $6.94bn. Revenue exposure therefore reflects both enterprise usage intensity and subscription retention.
44% of recognized revenue came through cloud-service-provider marketplaces.
Top-five accounts: ~25%
No single customer exceeded 10% of revenue in the nine months to September, but the five largest represented about one quarter of sales. Contracts and usage can change quickly.
The dual role of partners
Cloud platforms can supply infrastructure, distribute models, bill customers and hold equity. That creates strategic reach alongside dependency and potential conflicts.
Control is not proportional to public ownership
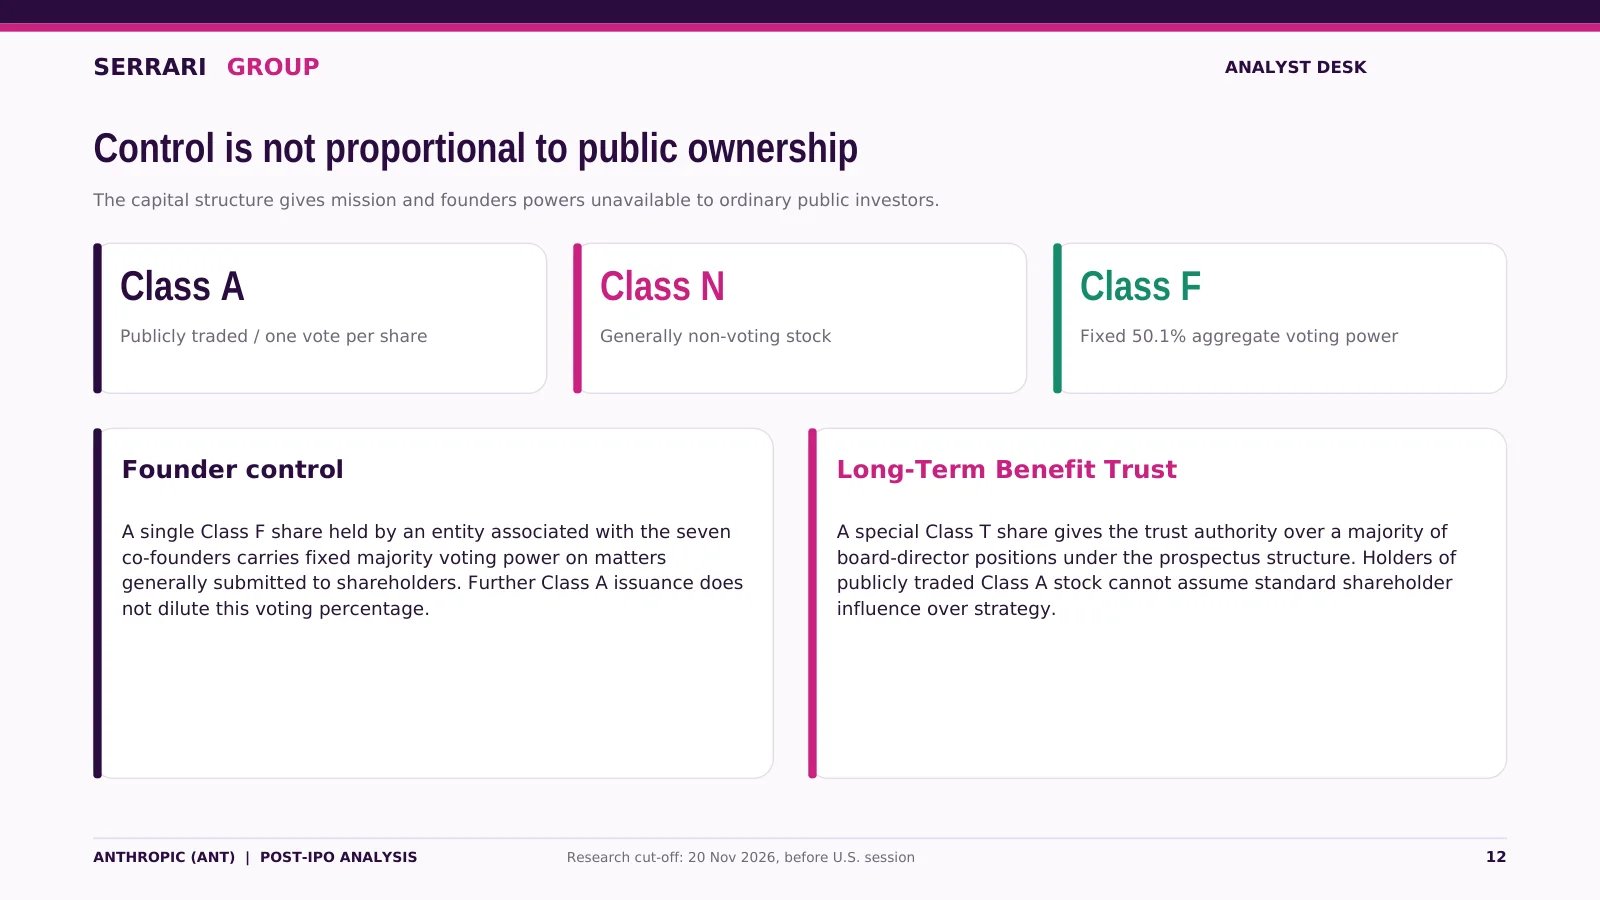
The capital structure gives mission and founders powers unavailable to ordinary public investors.
Class A — Publicly traded / one vote per share
Class N — Generally non-voting stock
Class F — Fixed 50.1% aggregate voting power
Founder control
A single Class F share held by an entity associated with the seven co-founders carries fixed majority voting power on matters generally submitted to shareholders. Further Class A issuance does not dilute this voting percentage.
Long-Term Benefit Trust
A special Class T share gives the trust authority over a majority of board-director positions under the prospectus structure. Holders of publicly traded Class A stock cannot assume standard shareholder influence over strategy.
Risk map: where a premium valuation can break
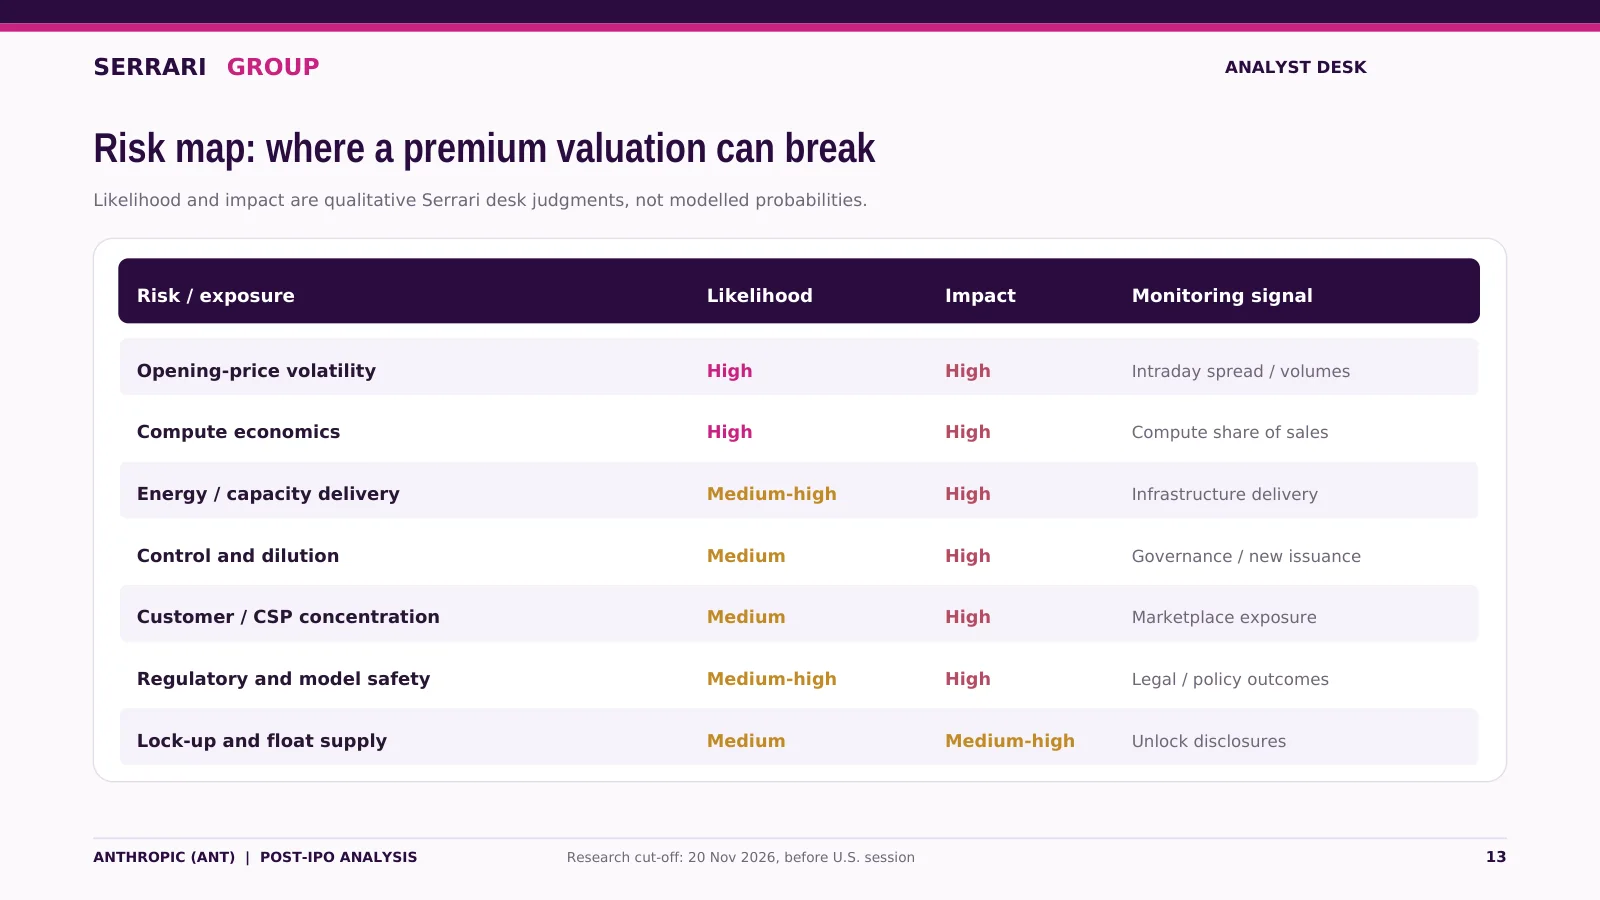
| Risk / exposure | Likelihood | Impact | Monitoring signal |
|---|---|---|---|
| Opening-price volatility | High | High | Intraday spread / volumes |
| Compute economics | High | High | Compute share of sales |
| Energy / capacity delivery | Medium-high | High | Infrastructure delivery |
| Control and dilution | Medium | High | Governance / new issuance |
| Customer / CSP concentration | Medium | High | Marketplace exposure |
| Regulatory and model safety | Medium-high | High | Legal / policy outcomes |
| Lock-up and float supply | Medium | Medium-high | Unlock disclosures |
Likelihood and impact are qualitative Serrari desk judgments, not modelled probabilities.
Figure: Risk map — where a premium valuation can break.
Scenario map: value depends on duration and dilution
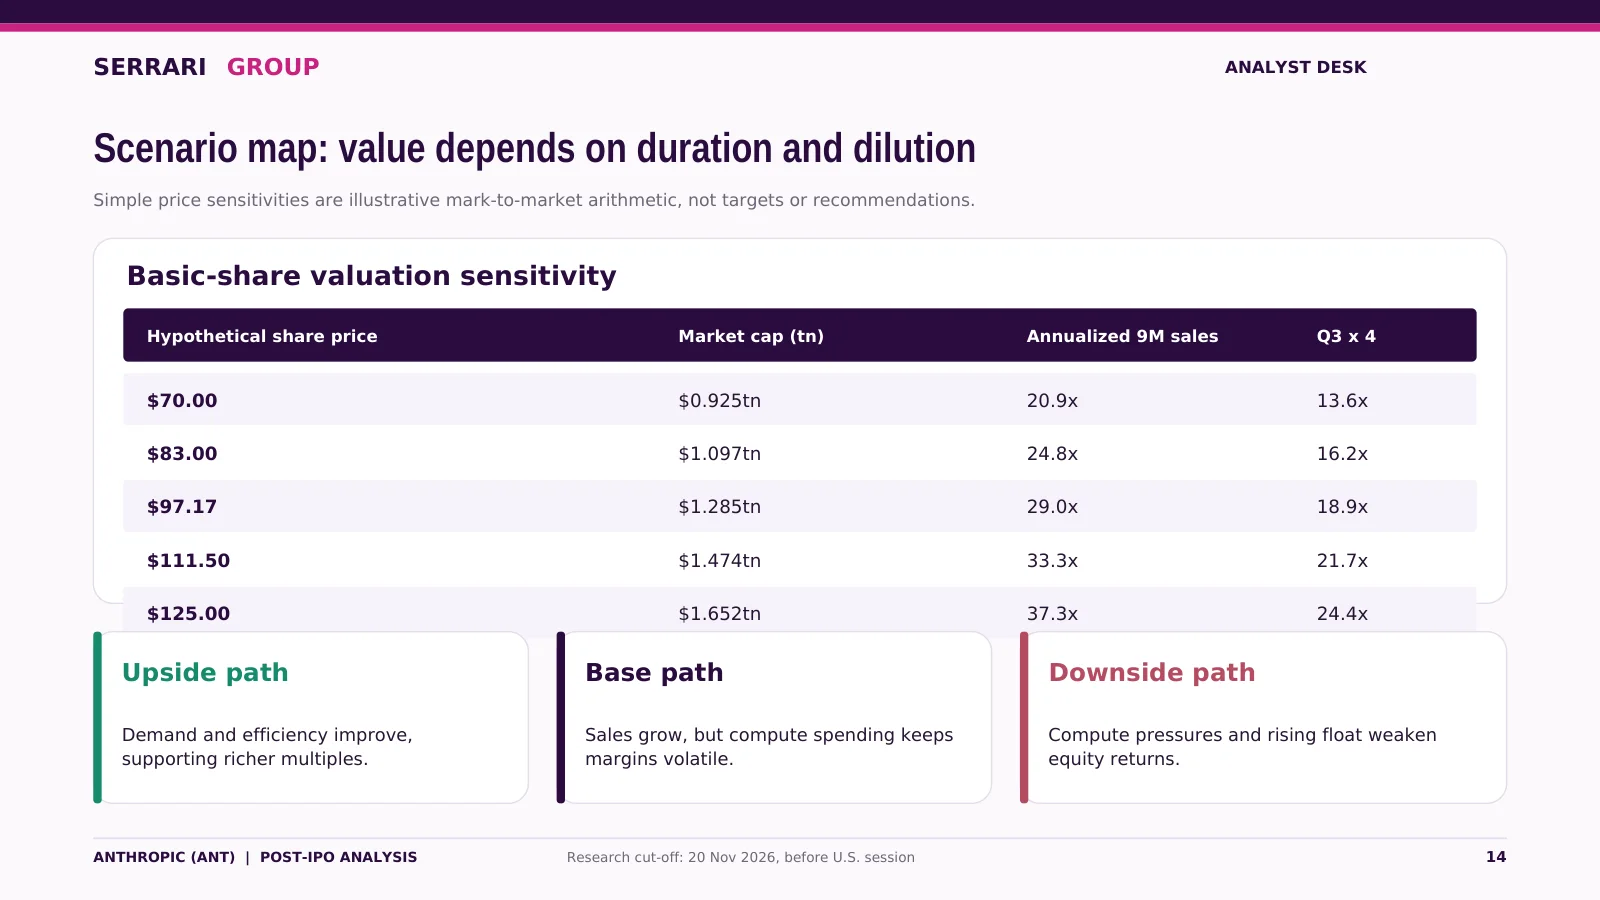
| Hypothetical share price | Market cap (tn) | Annualized 9M sales | Q3 x 4 |
|---|---|---|---|
| $70.00 | $0.925tn | 20.9x | 13.6x |
| $83.00 | $1.097tn | 24.8x | 16.2x |
| $97.17 | $1.285tn | 29.0x | 18.9x |
| $111.50 | $1.474tn | 33.3x | 21.7x |
| $125.00 | $1.652tn | 37.3x | 24.4x |
Simple price sensitivities are illustrative mark-to-market arithmetic, not targets or recommendations.
Basic-share valuation sensitivity
Upside path — Demand and efficiency improve, supporting richer multiples.
Base path — Sales grow, but compute spending keeps margins volatile.
Downside path — Compute pressures and rising float weaken equity returns.
Conclusion and evidence register
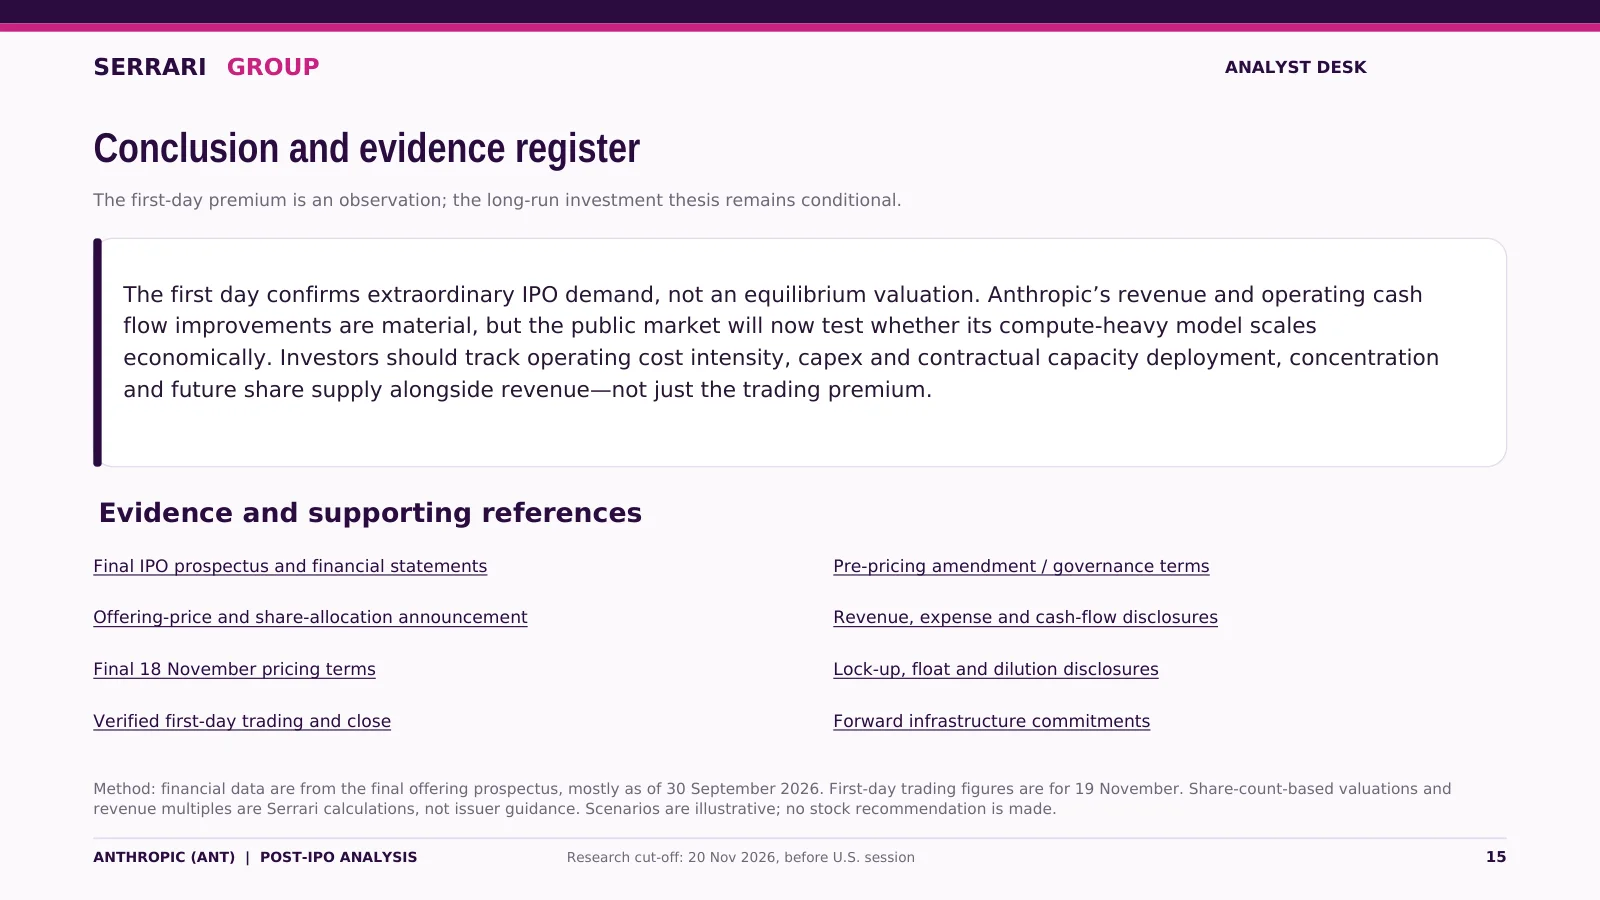
The first-day premium is an observation; the long-run investment thesis remains conditional.
The first day confirms extraordinary IPO demand, not an equilibrium valuation. Anthropic's revenue and operating cash flow improvements are material, but the public market will now test whether its compute-heavy model scales economically. Investors should track operating cost intensity, capex and contractual capacity deployment, concentration and future share supply alongside revenue—not just the trading premium.
Evidence and supporting references
- Final IPO prospectus and financial statements
- Offering-price and share-allocation announcement
- Final 18 November pricing terms
- Verified first-day trading and close
- Pre-pricing amendment / governance terms
- Revenue, expense and cash-flow disclosures
- Lock-up, float and dilution disclosures
- Forward infrastructure commitments
Method: financial data are from the final offering prospectus, mostly as of 30 September 2026. First-day trading figures are for 19 November. Share-count-based valuations and revenue multiples are Serrari calculations, not issuer guidance. Scenarios are illustrative; no stock recommendation is made.