


Meta: Bitcoin surges 3.29% to $71,278 on Iran ceasefire signals, as $934M in ETF inflows and dwindling exchange supply build a structural price floor.
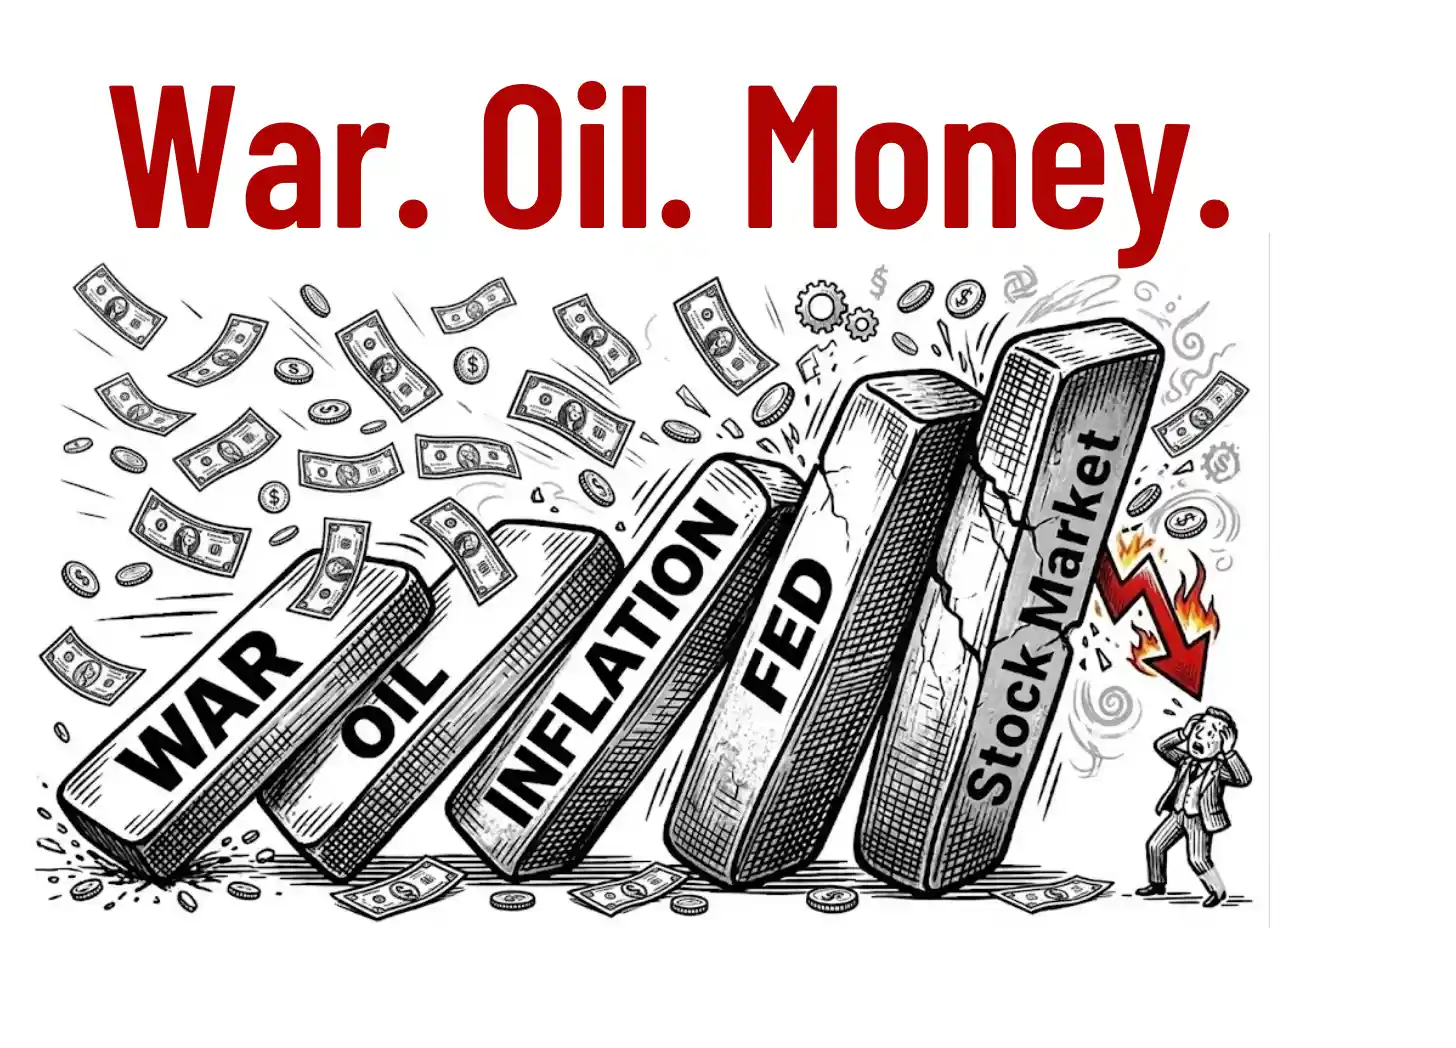
Bitcoin (BTC-USD) is trading at approximately $71,278 on March 10, 2026, up 3.29% on the day — a move that looks clean on the surface but carries layers of complexity underneath. The catalyst is unambiguous: President Trump signalled a potential early end to the US-Israel offensive against Iran, crude oil collapsed 12% from its $119 peak, and risk assets across every asset class caught a violent bid simultaneously. Equities rallied, crypto surged, and the fear gauge — the Cboe Volatility Index — dropped 10% to 22.93. Bitcoin’s move was not random. It was the most direct expression of the market’s relief trade.
But the honest structural read of what $71,278 actually means requires holding two numbers in tension simultaneously. Bitcoin is up 3.29% today, but it remains down approximately 9.85% from one year ago when it was trading near $78,575, and still sits roughly 44% below its 2025 cycle peak near $126,000. The day-over-day gain is striking. The year-over-year context is sobering. Any serious positioning in BTC right now demands reconciling both.
Markets move fast; don’t get left behind. We’ve paired the Serrari Group Market Index with a curated Marketplace and a comprehensive Financial Literacy Course to ensure you have the data—and the skills—to act on it.
The Short Squeeze Beneath the Rally
The price action on Monday and Tuesday was not gentle accumulation — it was a forced short squeeze. On-chain analytics confirm that BTC pushed above $70,000 and liquidated $186 million in short positions within a 24-hour window. That is not organic buying pressure. That is a mechanical event driven by leveraged traders caught on the wrong side of a geopolitically driven reversal. The distinction matters enormously for understanding whether the move is durable.
The order book structure adds important context. The $70,000–$72,000 zone carries relatively thin liquidity, meaning price can push through it without requiring massive buy volume. Above that, the next significant short liquidation cluster sits between $74,000 and $75,000 on the weekly time frame, according to CoinGlass liquidation heatmap data. That level is a magnet. The market will almost certainly attempt to sweep the $72,000 pocket before any meaningful reversal — the mechanics of a liquidity-driven market virtually guarantee it.
The concerning side of the ledger sits below. The $64,000–$68,000 range holds short liquidation clusters that are approximately four times larger in aggregate than the clusters above the current price. That asymmetry is the critical variable. Once the $72,000 liquidity sweep occurs, the path of least resistance for a follow-through move becomes a deep retracement toward the $64,000–$68,000 zone. This is not a prediction of catastrophe. It is a read of where the liquidity actually lives.
Technical Recovery: RSI Moves from Oversold to Momentum Territory
Strip away the geopolitical catalyst and the technical picture has been quietly improving for days. Bitcoin’s 14-day Relative Strength Index moved from 30 on March 1 — a level associated with oversold conditions — to 52 by Tuesday, according to Glassnode data. That is a 22-point swing in nine days, which Glassnode characterises as signalling a “modest improvement in BTC momentum” pointing to “high buyer activity.” A 14-day RSI at 52 is not yet in overbought territory, which means there is technical runway before the oscillator becomes a sell signal.
Spot trading volume has confirmed the move in parallel. BTC spot volume hit $9.3 billion at the time of writing, up from just $3.38 billion on Saturday — a 140%-plus surge in three days. Volume confirms price moves in ways that price alone cannot. A 3.29% rally on $9.3 billion in spot volume is a categorically different event from a 3.29% rally on thin-tape volume. The buying is real.
ETF Inflows: The $934 Million Institutional Signal
The Spot Bitcoin ETF ecosystem has become the dominant institutional demand signal for BTC in 2026, and the current flow data is unambiguously positive. Net weekly inflows hit $934 million most recently — a 20% increase from the $776 million recorded the prior week — with trading volumes rising to $23.1 billion from $16 billion. On Monday alone, spot Bitcoin ETFs attracted $167 million in net inflows. Global Bitcoin investment products logged $521 million in total net inflows for the same period, contributing direct upward price pressure.
The ETF rotation narrative is gaining structural credibility. Bitcoin ETFs have recorded net positive inflows over the past 30 days while gold ETFs saw record outflows during the same window. Capital appears to be moving from gold into Bitcoin at the institutional level — a shift that, if it sustains, would represent one of the most significant realignments in how large pools of capital store value in a generation.
It is worth understanding why ETF inflows do not always translate into immediate price movement. Analysts at Bitfinex explained that ETF structures often create a lag between inflows and actual Bitcoin purchases because authorised participants can create and short ETF shares before buying the underlying Bitcoin, delaying real spot-market purchases. “The result is that the ETF grows, but the actual BTC price doesn’t rise because there has been no buying in the spot market,” Bitfinex analysts noted. “Generally, this does not have a significant market impact, but in periods of severe market dislocation, the gap between ETF demand and real BTC spot buying can create a short period of market mispricing.”
Since their US debut in January 2024, spot Bitcoin ETFs have cumulatively registered inflows worth over $55 billion, establishing an entirely new institutional demand channel that did not exist in prior Bitcoin market cycles. The sustained nature of this demand — particularly from long-horizon institutional allocators — creates durable price floors rather than speculative spikes. When retail drives a rally, the reversal is sharp. When institutional ETF flows drive a rally, corrections tend to find support because the cost basis is higher and the holders have longer time horizons.
Bhutan’s Structured Selldown: Sovereign Treasury Management, Not Panic
One of the most consequential supply-side dynamics in Bitcoin right now is the systematic liquidation of Bhutan’s sovereign Bitcoin holdings through its state investment arm, Druk Holding and Investments (DHI). On Monday alone, blockchain analytics from Arkham Intelligence confirmed that the Royal Government of Bhutan transferred 175 BTC worth $11.85 million to a wallet address that had previously received 184 BTC in February — strongly implying a consistent OTC or treasury management counterparty.
February’s activity was more extensive than a single transfer. Arkham’s on-chain data shows four separate moves that month: the 184 BTC transfer, two sends to QCP Capital’s merchant deposit address totalling roughly 200 BTC worth $15 million combined, and a $1.5 million USDT transfer to a Binance hot wallet. That’s approximately $30.7 million in February alone, followed by Monday’s $11.85 million, bringing 2026 outflows to roughly $42.5 million in total.
The pattern — same counterparties, similar transaction sizes, no correlation to price movements — points to a structured treasury drawdown rather than reactive selling. Arkham specifically noted that “Bhutan periodically sells portions of its Bitcoin in clips of $5 million to $10 million,” a description that reads like orderly wealth management, not sovereign capitulation.
The scale of the reduction since peak is striking. Bhutan’s Bitcoin stack peaked at approximately 13,000 BTC in late 2024 and has now fallen to roughly 5,400 BTC — a 58% reduction. At the 2024 peak, those holdings were valued at over $1.5 billion when BTC was trading near $126,000. At today’s price of approximately $71,000, the remaining 5,400 BTC is worth around $374 million. Crucially, the government mined the majority of its Bitcoin using surplus Himalayan hydropower, giving it a near-zero cost basis. Every single transfer — at any price above essentially zero — represents pure profit for the Bhutanese state, which directs proceeds toward healthcare, environmental initiatives, and public employee salaries, according to Prime Minister Tshering Tobgay.
In December, Bhutan unveiled a national Bitcoin Development Pledge committing up to 10,000 BTC to fund Gelephu Mindfulness City, a special economic zone designed to hold digital assets as part of its financial reserves. That pledge, combined with the current drawdown pace, suggests DHI may reduce holdings further toward a strategic floor position — maintaining meaningful exposure without the overhead of active treasury management.
Since the 2024 halving cut mining rewards to 3.125 BTC per block, Bhutan has also been redirecting some energy resources from Bitcoin mining toward high-performance computing — a rational economic response to compressed mining profitability. New supply is no longer being generated at the previous rate, meaning the drawdown comes purely from the accumulated stack rather than being offset by ongoing production.
For the broader market, Bhutan’s selling programme is meaningful but manageable. $42.5 million distributed across multiple months through institutional counterparties like QCP Capital does not create the kind of price impact that a $42.5 million market-sell order would. The structured nature of the programme is arguably bullish — it signals that even a sovereign seller with a near-zero cost basis and full liquidity is choosing to distribute slowly rather than dump.
Bhutan currently ranks as the seventh-largest government Bitcoin holder globally. The United States holds 328,372 BTC valued at approximately $22 billion at current prices — the largest government stack by a wide margin, accumulated almost entirely through asset seizures and prosecutorial forfeitures rather than active mining. Bhutan’s operational model is radically different: a state-owned, hydropower-driven mining programme that built its stack from near zero in 2021. The cost basis comparison is academically irrelevant — both governments are sitting on pure profit — but the management philosophy diverges sharply. Bhutan monetises. The US holds.
The Stock-to-Flow Debate: $500,000 Average or Model in Decline?
The Stock-to-Flow model, popularised for Bitcoin by pseudonymous analyst PlanB in 2019, is back in active debate. The model adapts a commodity valuation framework — dividing total existing supply by annual new production — and applies it to Bitcoin’s programmatic scarcity schedule. Gold carries a stock-to-flow ratio of roughly 60–70, meaning approximately 60 years of current mining production would be required to replicate the existing above-ground stock. Bitcoin’s ratio is higher and rises structurally after every halving.
With just over 20 million Bitcoin in circulation and the 2024 halving having cut new supply to 3.125 BTC per block, the model’s current projection for the 2024–2028 halving cycle implies an average price near $500,000, with a potential range extending from $250,000 to $1 million at cycle peak. PlanB framed it directly on X: “Bitcoin at $67,000. But S2F model screams $500,000 average this cycle.”
At $71,278 today, Bitcoin is trading at approximately 14% of the model’s implied average. Supporters point to precedent — the historical “blue zone” periods when Bitcoin traded significantly below the model’s implied value, including 2015 when BTC was below $400, consistently preceded the largest rallies in the asset’s history.
The criticism of the model is equally serious and should not be dismissed. Bitcoin diverged sharply from S2F projections following the 2021 peak, when the model implied prices that the market never reached on a sustained basis. Critics argue that as Bitcoin’s market cap grows toward and beyond $1 trillion, the universe of capital required to drive the model’s price targets becomes increasingly implausible. For BTC to average $500,000 this cycle, its market cap would need to sustain around $10 trillion — roughly equivalent to the entire current US equity market. That is not impossible, but it requires a level of institutional adoption and global capital allocation that has not yet materialised.
The honest assessment: the S2F model is a useful framework for understanding Bitcoin’s scarcity dynamics, not a reliable precision price prediction mechanism. The directional implication — higher over time as supply growth decelerates — is almost certainly correct. The specific price targets are illustrative, not precise. For investors, the model’s value lies in framing the magnitude of the opportunity, not in providing entry and exit signals.
Context is everything. While you follow today’s updates, use the Serrari Market Index and Marketplace to spot emerging shifts. Need to sharpen your edge? Our Financial Literacy Course turns these insights into a professional-grade strategy.
Exchange Supply at 2019 Lows: The Supply Squeeze Is Real
Beyond the price action and model debates, one on-chain data point stands out as genuinely significant. Bitcoin supply held on exchanges has dropped to 2019 levels, according to aggregated Glassnode data. When coins move off exchanges into private wallets and cold storage, it signals that holders are not positioning to sell in the near term. Exchange supply reduction tightens the immediately available float and makes price more sensitive to demand spikes — a smaller absolute amount of Bitcoin needs to be bought to move the price higher when the sellable supply is constrained.
2019 levels of exchange supply, combined with the post-halving supply reduction and the ETF demand dynamics discussed above, creates a structural squeeze. The supply side is thinning; the demand side — through ETF inflows of $934 million and persistent institutional buying — is growing. When supply shrinks and demand grows simultaneously, price resolution is not complicated.
The Glassnode March 9 Weekly Market Pulse characterised current conditions as stabilising, noting that “ETF activity remains a relative area of strength” with “net inflows accelerating and trading volumes picking up.” The firm also cautioned, however, that “capital flows remain soft” and the market “still looks fragile rather than fully re-energised” — a framing that captures the central tension precisely. Some internals are healing; the macro catalyst for a decisive breakout has not yet arrived.
Altcoin Performance: Risk Appetite Is Speculative, Not Institutional
The broader altcoin performance on the day confirms the geopolitically-driven nature of the risk-on rotation. Ethereum (ETH-USD) traded up 2.82% — a solid move, but underperforming Bitcoin’s 3.29% gain, which suggests BTC dominance is holding or expanding during this relief rally. XRP (XRP-USD) rose a more aggressive 5.15% to $1.43, reflecting higher beta to risk-on sentiment. Dogecoin (DOGE-USD) surged 8.86% to $0.10, while Cardano (ADA-USD) gained 6.02% to $0.27. Solana (SOL-USD) advanced 3.79% to $88.32, and Sui (SUI-USD) moved 7.13% to $1.00. Shiba Inu (SHIB-USD) posted the session’s largest percentage gain among major tokens at 9.29%, while Pepe (PEPE-USD) added 4.50%.
The divergence between DOGE’s 8.86% gain and BTC’s 3.29% gain is a cautionary signal. When the most speculative corners of crypto lead Bitcoin by 5-6 percentage points in a single session, it typically signals speculation-grade risk appetite rather than institutional conviction. Institutional capital flows into BTC and BTC ETFs. Retail capital flows into high-beta meme tokens. These moves have no connection to the Iran conflict resolution thesis or any fundamental driver; they are momentum trades, pure and simple.
Strategy Inc.: The Leveraged Bitcoin Proxy Underperforms
Strategy Inc. (MSTR), the world’s largest corporate Bitcoin holder, traded at $140.90 on the day — up approximately 1.40% — underperforming Bitcoin’s 3.29% gain, which is unusual for a leveraged proxy. On a typical session when Bitcoin surges 3.29%, MSTR moves 5–7% or more due to its embedded leverage structure. The muted relative performance may reflect equity market dynamics, position unwinding, or sector rotation rather than any fundamental MSTR-specific concern.
Strategy’s thesis is unambiguous: it is a Bitcoin holding company with a software business attached. As of early March 2026, Strategy held 738,731 BTC — the largest corporate Bitcoin treasury on earth by an enormous margin — accumulated through equity issuance and over $8.2 billion in convertible notes. Its performance is almost entirely a function of BTC price multiplied by leverage. At $71,278 Bitcoin, the arithmetic works in the bulls’ favour. If BTC reaches $100,000 this cycle — a level requiring only a 40% gain from today’s price — MSTR’s Bitcoin NAV would expand dramatically and the stock would likely outperform BTC itself. If BTC retraces to $60,000 before that happens, the company’s debt load becomes the central conversation.
The Fed Variable: Oil Weakness as a Dovish Pivot Catalyst
Bitcoin’s price trajectory is not isolated from macroeconomic conditions, and the Federal Reserve’s rate path is the most critical macro variable right now. Bank of America economist Aditya Bhave made the case this week that the consensus hawkish interpretation of rising oil prices is incorrect — today’s labour market, inflation backdrop, and fiscal environment are categorically less inflationary than 2022, when core PCE was above 5% and payrolls ran at 500,000 per month. The implication: a supply shock from the Iran war is more likely to generate a dovish Fed response than a hawkish one if the shock proves persistent and starts hitting consumption.
For Bitcoin, a dovish Fed pivot is one of the most powerful bullish catalysts possible. Rate cuts reduce the opportunity cost of holding non-yielding assets. The dollar weakens — already down 0.19% to 95.38 on the day. Real yields compress. Capital searches for alternatives to cash and bonds. Bitcoin has historically performed best in low-rate, dollar-weakness environments. With crude oil now at $83 and potentially declining further as the G7 prepares strategic reserve releases, the inflation scare that was driving hawkish rate expectations is unwinding in real time.
The 10-year Treasury yield at 4.118% and stabilising is the key signal to watch. If yields break below 4% on continued oil weakness and ceasefire progress, the rate environment becomes significantly more accommodative for Bitcoin. If the Iran conflict reignites and oil spikes back toward $100–$120, rate fears return and BTC faces renewed headwinds.
Gold vs. Bitcoin: Rotation or Cyclical Trade?
Gold is at $5,236.50, up 2.60% on the day — a genuinely impressive safe-haven move on a day when equities are also rising. But the 30-day ETF flow data tells a structurally different story. Gold ETFs have seen record outflows over the past 30 days while Bitcoin ETFs attracted net positive inflows during the same period. That rotation — from the most established store of value in human history into a 15-year-old digital asset — is either the beginning of a structural generational shift in how institutional capital stores value, or a cyclical momentum trade that will reverse.
The structural bull case for Bitcoin in this context is grounded in verifiable properties: its market cap at approximately $1.33 trillion now approaches gold’s territory from below; it has survived multiple regulatory attacks, exchange collapses, and 80%-plus drawdowns; its scarcity is mathematically enforced by protocol rules, unlike gold’s which depends on variable mining economics; and the ETF wrapper has made it institutionally accessible at scale in a way that was not possible before January 2024.
The counterargument is equally grounded: gold carries a 5,000-year track record as a store of value. Bitcoin has 15 years. The current rotation may reflect recency bias from BTC’s 2024–2025 performance and could snap back sharply if Bitcoin underperforms during the next genuine systemic crisis period.
The Structural Verdict: Supply Is Thinning, Demand Is Growing
The overall setup — exchange supply at 2019 lows, $934 million in weekly ETF inflows, $186 million in short liquidations confirming directional momentum, and an RSI recovering from 30 to 52 — all point in the same structural direction. The supply side is thinning. The demand side is persistent. The on-chain data does not lie: net buying is occurring across major exchanges, sovereign sellers are distributing in orderly clips rather than dumping, and the post-halving supply reduction continues to compound the structural squeeze.
The liquidity map, however, carries a warning that disciplined investors should not ignore. The $72,000 sweep is likely, and what follows that sweep determines whether this rally extends toward $85,000–$90,000 or revisits the $64,000–$68,000 zone where four times more aggregate liquidation exposure sits. The realistic bull case — Bitcoin clears $72,000, finds support, and builds toward the $85,000–$90,000 range as ETF inflows sustain and the Fed pivots dovish — is achievable if macro conditions cooperate. The realistic bear case is a flush to $64,000–$68,000 before a base is established for the next leg higher.
Both scenarios are consistent with a structural setup that, over a 12–18 month horizon, points higher. The S2F model’s $500,000 cycle average may be illustrative rather than precise, but the directional logic it encodes — that a digitally scarce asset with growing institutional adoption should command a higher price as new supply decelerates — is difficult to argue against. The question is not whether Bitcoin goes higher from here. The question is the path it takes to get there.
Don’t just read the news—navigate it. Track trends with the Serrari Group Market Index, discover your next move in the Serrari Marketplace, and master the “how” with our Financial Literacy Course.
Photo Source: Google
By: Montel Kamau
Serrari Financial Analyst
12th March, 2026
Article, Financial and News Disclaimer
The Value of a Financial Advisor
While this article offers valuable insights, it is essential to recognize that personal finance can be highly complex and unique to each individual. A financial advisor provides professional expertise and personalized guidance to help you make well-informed decisions tailored to your specific circumstances and goals.
Beyond offering knowledge, a financial advisor serves as a trusted partner to help you stay disciplined, avoid common pitfalls, and remain focused on your long-term objectives. Their perspective and experience can complement your own efforts, enhancing your financial well-being and ensuring a more confident approach to managing your finances.
Disclaimer: This article is for informational purposes only and does not constitute financial advice. Readers are encouraged to consult a licensed financial advisor to obtain guidance specific to their financial situation.
Article and News Disclaimer
The information provided on www.serrarigroup.com is for general informational purposes only. While we strive to keep the information up to date and accurate, we make no representations or warranties of any kind, express or implied, about the completeness, accuracy, reliability, suitability, or availability with respect to the website or the information, products, services, or related graphics contained on the website for any purpose. Any reliance you place on such information is therefore strictly at your own risk.
www.serrarigroup.com is not responsible for any errors or omissions, or for the results obtained from the use of this information. All information on the website is provided on an as-is basis, with no guarantee of completeness, accuracy, timeliness, or of the results obtained from the use of this information, and without warranty of any kind, express or implied, including but not limited to warranties of performance, merchantability, and fitness for a particular purpose.
In no event will www.serrarigroup.com be liable to you or anyone else for any decision made or action taken in reliance on the information provided on the website or for any consequential, special, or similar damages, even if advised of the possibility of such damages.
The articles, news, and information presented on www.serrarigroup.com reflect the opinions of the respective authors and contributors and do not necessarily represent the views of the website or its management. Any views or opinions expressed are solely those of the individual authors and do not represent the website's views or opinions as a whole.
The content on www.serrarigroup.com may include links to external websites, which are provided for convenience and informational purposes only. We have no control over the nature, content, and availability of those sites. The inclusion of any links does not necessarily imply a recommendation or endorsement of the views expressed within them.
Every effort is made to keep the website up and running smoothly. However, www.serrarigroup.com takes no responsibility for, and will not be liable for, the website being temporarily unavailable due to technical issues beyond our control.
Please note that laws, regulations, and information can change rapidly, and we advise you to conduct further research and seek professional advice when necessary.
By using www.serrarigroup.com, you agree to this disclaimer and its terms. If you do not agree with this disclaimer, please do not use the website.
www.serrarigroup.com, reserves the right to update, modify, or remove any part of this disclaimer without prior notice. It is your responsibility to review this disclaimer periodically for changes.
Serrari Group 2025