


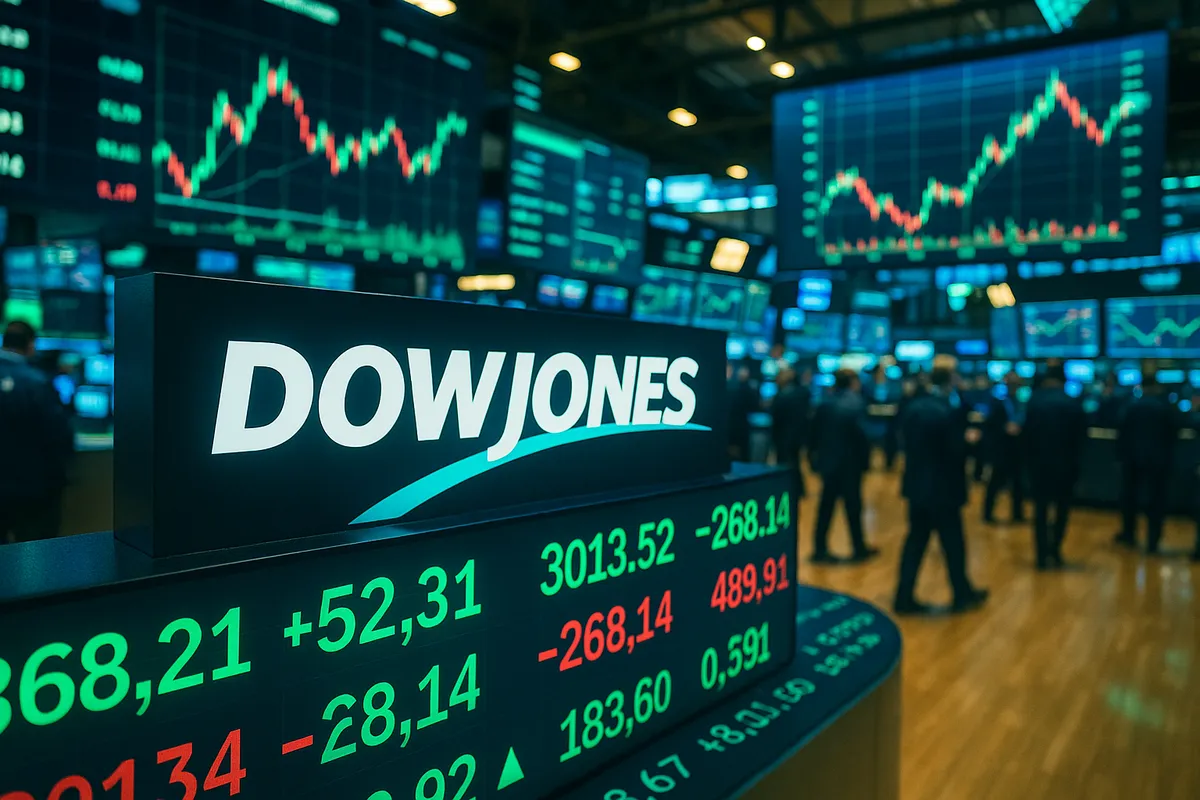
The Dow Jones Industrial Average staged a turbulent recovery on March 11, 2026, rising more than 250 points to reclaim the 48,000 level after earlier plunging as much as 300 points — a 550-point intraday swing that captures exactly how fractured investor confidence has become since the U.S.-Israeli military campaign against Iran began on February 28. The S&P 500 and Nasdaq Composite also advanced. But beneath the surface of that recovery lies a far more complicated picture: crude oil shed roughly 10% on the day, gold held near $5,195 per ounce, the U.S. Dollar Index softened, and the Strait of Hormuz remained effectively closed to tanker traffic. What looks like a relief rally on the surface may be one of the most dangerous bull traps of 2026.
Markets move fast; don’t get left behind. We’ve paired the Serrari Group Market Index with a curated Marketplace and a comprehensive Financial Literacy Course to ensure you have the data—and the skills—to act on it.
The IEA’s Record Reserve Release: A Historic Move That May Not Be Enough
The primary catalyst for oil’s sharp single-day pullback was an announcement from the International Energy Agency that its 32 member nations would collectively release 400 million barrels of oil from strategic stockpiles — the largest coordinated emergency release in the agency’s 52-year history, surpassing the 182 million barrels released after Russia invaded Ukraine in 2022. The United States alone committed to contributing 172 million barrels from the Strategic Petroleum Reserve, starting the following week, with deliveries expected to take approximately 120 days to complete.
IEA Executive Director Fatih Birol, speaking from the agency’s Paris headquarters, called the decision “an emergency collective action of unprecedented size,” but was careful to frame its limitations. “The most important thing for a return to stable flows of oil and gas is the resumption of transit through the Strait of Hormuz,” Birol said, acknowledging that no quantity of reserve releases could substitute for reopening the world’s most critical maritime oil chokepoint.
Markets took the hint. While WTI briefly dipped to approximately $84 a barrel and Brent fell to around $88 — both having touched above $100 earlier in the week — prices climbed back sharply before the day’s close, with WTI settling above $87 as traders digested the reality that the IEA release represents only about four days of global oil production, according to Macquarie analyst estimates. Bob McNally, president of Rapidan Energy Group, was more blunt: “Traders are now doing the math and realize that IEA drawdowns can at best only offset a fraction of the roughly 15 million barrels per day net supply loss of crude and refined products due to the ongoing halt to most tanker transits.”
There is a historical parallel worth studying. When the IEA coordinated a reserve release during the Libyan civil war in 2011, the drawdown provided temporary price relief — but only because Libya’s disruption was eventually resolved. The Strait of Hormuz, through which approximately 20 million barrels of oil transit daily — equivalent to roughly 20% of global oil consumption — remains a far more complex problem. Iran has reportedly been laying naval mines in the waterway, and the U.S. military destroyed 16 Iranian minelayers near the strait on Tuesday, deepening the likelihood that full tanker traffic will not resume for weeks at minimum. CNN reported that export volumes of crude and refined products through Iran’s end of the Persian Gulf are currently running at less than 10% of pre-war levels.
For derivatives traders, the situation argues for a measured approach to crude positioning. Selling out-of-the-money put options on WTI crude captures the elevated implied volatility while betting that the $84 level holds as near-term support — a reasonable tactical play so long as the conflict shows any sign of trending toward de-escalation. But that is a significant conditional, and should be sized accordingly.
The Dow at 48,000: A Relief Rally Built on Fragile Hopes
The Dow’s ability to recover to 48,000 after earlier dropping more than 800 points in the session earlier in the week reflects the same pattern that has defined equity markets since Operation Epic Fury began: sharp dip-buying on any news that suggests the conflict might wind down, followed by partial retracement as geopolitical reality reasserts itself. Choppy trading within a 550-point intraday range is not the hallmark of a market with conviction — it is a market clinging to hope while positioning for outcomes it cannot predict.
The stock-specific moves on March 11 underscored the rotational complexity. Caterpillar gained more than 3%, a move consistent with its role as an industrial bellwether benefiting from the AI data center infrastructure buildout and ongoing domestic manufacturing investment. Cisco rose approximately 1.7%, benefiting from similar infrastructure tailwinds. Conversely, Salesforce fell about 3% — a sign that enterprise software spending is coming under pressure as corporations begin to assess the cost impact of elevated energy prices on operating budgets. UnitedHealth slipped around 1.7%, and IBM declined more than 2%, extending year-to-date losses that now exceed 11%.
This divergence between hard-asset industrials and enterprise software is not random noise — it is a meaningful rotation that is likely to persist. When energy costs surge, corporate CFOs begin reviewing discretionary technology spending, and subscription-based software platforms like Salesforce are among the first items to face budget scrutiny. Caterpillar, by contrast, is directly exposed to the kind of large-scale infrastructure investment — power generation, data centers, logistics — that does not slow down because of an oil shock. It accelerates, as builders race to establish energy independence and build out the physical backbone of AI.
For investors comfortable with options strategies, a pairs trade that goes long Caterpillar call options while buying puts on Salesforce captures this rotation at favorable implied volatility levels on both sides. The divergence in near-term fundamentals between the two companies is clear, and the options market is currently pricing in enough uncertainty to make the position structurally attractive.
Against a backdrop of this level of uncertainty, the prudent hedge on broad index exposure remains buying protective put options on the SPDR Dow Jones ETF (DIA) or the S&P 500 ETF (SPY). These serve as portfolio insurance against a sudden reversal should peace talks fail to materialize or the Hormuz situation deteriorate further. The cost of that insurance, relative to the downside risk of an unhedged long position in an equity market at these levels, is highly justified.
Context is everything. While you follow today’s updates, use the Serrari Market Index and Marketplace to spot emerging shifts. Need to sharpen your edge? Our Financial Literacy Course turns these insights into a professional-grade strategy.
CPI Arrives On Cue — and Is Already Obsolete
The February Consumer Price Index, released on the morning of March 11 by the Bureau of Labor Statistics, arrived precisely in line with expectations: headline CPI rose 0.3% month-on-month and 2.4% year-on-year, while core CPI — stripping out food and energy — came in at 0.2% month-on-month and 2.5% year-on-year. Both the headline and core annual readings were unchanged from January.
The market’s muted reaction to the print was entirely rational. As Joe Seydl, senior markets economist at J.P. Morgan Private Bank, told CNBC, the February report is “a bit stale at this point” — collected entirely before the outbreak of the Iran war on February 28, and therefore capturing none of the energy shock that has already driven gasoline prices up approximately 57 cents per gallon, or roughly 19%, since hostilities began. Average gasoline nationally has already reached around $3.57 per gallon as of this week’s data.
The real inflation test lies ahead. The March CPI report, due in mid-April, will be the first full monthly reading to capture the energy shock in its entirety. “CPI inflation for February was along expectations but this is the calm before the storm that will show up due to surging gasoline prices in March,” said Sonu Varghese, chief macro strategist at the Carson Group. Economists at CNBC have noted that a prolonged conflict leading U.S. oil prices to average around $100 per barrel could push headline CPI to 3.5% by year-end — more than a full percentage point above current readings.
That is precisely why the February CPI report, despite its on-target print, matters less than it would under normal circumstances. The Fed’s March 18 meeting is universally expected to result in no rate change — the probability of a hold rose to approximately 97-99% following the CPI release, according to the CME FedWatch tool. The real question is what happens to that calculus if April and May CPI prints come in at 3% or above, driven by energy spillover into airline fares, diesel-linked food transport costs, and petrochemical inputs. Derivatives markets should begin positioning for that scenario now, before the data confirms it.
Existing Home Sales Beat, Affordability Reaches Four-Year High
Not all of the day’s economic data carried the shadow of the Iran war. Existing home sales for February came in at 4.09 million — a 1.7% month-on-month increase that beat estimates calling for 3.89 million units — while January figures were revised meaningfully higher, to 4.02 million from 3.91 million. The 30-year fixed mortgage rate averaged approximately 6%, and the National Association of Realtors’ Housing Affordability Index rose to 117.6 — the highest reading since March 2022 — as a combination of moderating mortgage rates and stable home prices improved the purchasing calculus for buyers.
The housing beat is a genuine bright spot, but its durability must be questioned in the context of the energy shock. If oil prices remain elevated and begin feeding into broader inflation, the Federal Reserve’s ability to deliver additional rate cuts — which most housing economists have been counting on to sustain the mortgage rate decline — becomes severely constrained. A “higher for longer” monetary policy outcome driven by energy-fueled CPI prints in April and May could quickly reverse the affordability gains that produced February’s strong sales print.
Gold at $5,195: The Market’s Most Honest Signal
While equity markets celebrated a Dow recovery to 48,000, gold’s behavior on March 11 sent a fundamentally different message about where sophisticated capital is actually positioned. Spot gold rose to approximately $5,195 per ounce, with silver surging approximately 5.5%, and the 10-year Treasury yield easing to about 4.12% — a combination that collectively suggests institutional investors are not yet convinced that the geopolitical risk premium is coming out of markets.
Gold’s journey to these levels has been extraordinary. The metal surged past $5,000 per ounce for the first time in history in late January 2026, when a confluence of Trump policy uncertainty, tariff fears, and a weaker dollar triggered a stampede into safe-haven assets. When the Iran war began on February 28, spot gold catapulted from approximately $5,100 to over $5,300 in a single session — one of the most dramatic safe-haven rallies in modern financial history. By March 5, even as equity markets were partially recovering, gold was still holding above $5,160 per ounce, with Peter Grant, senior metals strategist at Zaner Metals, declaring himself “bullish and [expecting] new all-time highs.”
The divergence between rising equities and rising gold on the same day is the most important signal in the market right now. Historically, gold and stocks tend to move in opposite directions — gold rises when investors fear risk, equities rise when they embrace it. When both rise simultaneously, it typically indicates that one cohort is wrong. Given that JPMorgan now forecasts gold reaching $6,300 per ounce by year-end 2026, driven by central bank demand and structural geopolitical risk premiums, the smart money’s bet appears to be that equities are the asset class that has mispriced the situation.
As Metals Focus analysts have noted, gold’s role has been reinforced by the waning safe-haven appeal of U.S. Treasuries — a structural shift that leaves gold as “the last haven standing” in a world where the 10-year Treasury yield has nudged higher since the Iran war began, signaling insufficient demand for government debt as a refuge. For investors with exposure to this environment, maintaining long positions in gold futures or options is not a speculative bet — it is a portfolio management imperative while the Strait of Hormuz remains closed and the March and April inflation data remain unknown quantities.
The Dollar Index’s 0.50% decline to 98.66 on the day adds another dimension to the gold thesis. A softer dollar directly lowers the acquisition cost of dollar-denominated gold for international buyers, broadening global demand at the margin and reinforcing the upward price trajectory.
The Macro View: Stagflation Risk Is Real and Underpriced
Taken together, the signals from March 11 paint a picture of an economy navigating a genuine stagflationary risk scenario — one where growth faces headwinds from elevated energy costs while inflation is structurally set to spike in the months ahead, constraining the Fed’s ability to provide monetary relief. Ed Yardeni, president of Yardeni Research, summarized the risk earlier in the week: “This chaos in the financial markets is all about the Strait of Hormuz,” he wrote. “This oil shock won’t end until ships can sail freely through the Strait. Until then, the financial markets are likely to become increasingly concerned about a 1970s-style stagflation scenario.”
For market participants, that framing is not hyperbolic — it is a risk scenario that now deserves a non-trivial probability weight. The Dow’s recovery to 48,000 on March 11 was a relief rally, not a resolution. The IEA’s record reserve release buys time, not closure. The February CPI’s clean 2.4% print is a relic of a pre-war economy. And gold’s stubborn elevation to $5,195 while equities recovered tells you precisely which cohort of investors is treating the peace narrative as durable — and which is not.
Don’t just read the news—navigate it. Track trends with the Serrari Group Market Index, discover your next move in the Serrari Marketplace, and master the “how” with our Financial Literacy Course.
Photo Source: Google
By: Montel Kamau
Serrari Financial Analyst
12th March, 2026
Article, Financial and News Disclaimer
The Value of a Financial Advisor
While this article offers valuable insights, it is essential to recognize that personal finance can be highly complex and unique to each individual. A financial advisor provides professional expertise and personalized guidance to help you make well-informed decisions tailored to your specific circumstances and goals.
Beyond offering knowledge, a financial advisor serves as a trusted partner to help you stay disciplined, avoid common pitfalls, and remain focused on your long-term objectives. Their perspective and experience can complement your own efforts, enhancing your financial well-being and ensuring a more confident approach to managing your finances.
Disclaimer: This article is for informational purposes only and does not constitute financial advice. Readers are encouraged to consult a licensed financial advisor to obtain guidance specific to their financial situation.
Article and News Disclaimer
The information provided on www.serrarigroup.com is for general informational purposes only. While we strive to keep the information up to date and accurate, we make no representations or warranties of any kind, express or implied, about the completeness, accuracy, reliability, suitability, or availability with respect to the website or the information, products, services, or related graphics contained on the website for any purpose. Any reliance you place on such information is therefore strictly at your own risk.
www.serrarigroup.com is not responsible for any errors or omissions, or for the results obtained from the use of this information. All information on the website is provided on an as-is basis, with no guarantee of completeness, accuracy, timeliness, or of the results obtained from the use of this information, and without warranty of any kind, express or implied, including but not limited to warranties of performance, merchantability, and fitness for a particular purpose.
In no event will www.serrarigroup.com be liable to you or anyone else for any decision made or action taken in reliance on the information provided on the website or for any consequential, special, or similar damages, even if advised of the possibility of such damages.
The articles, news, and information presented on www.serrarigroup.com reflect the opinions of the respective authors and contributors and do not necessarily represent the views of the website or its management. Any views or opinions expressed are solely those of the individual authors and do not represent the website's views or opinions as a whole.
The content on www.serrarigroup.com may include links to external websites, which are provided for convenience and informational purposes only. We have no control over the nature, content, and availability of those sites. The inclusion of any links does not necessarily imply a recommendation or endorsement of the views expressed within them.
Every effort is made to keep the website up and running smoothly. However, www.serrarigroup.com takes no responsibility for, and will not be liable for, the website being temporarily unavailable due to technical issues beyond our control.
Please note that laws, regulations, and information can change rapidly, and we advise you to conduct further research and seek professional advice when necessary.
By using www.serrarigroup.com, you agree to this disclaimer and its terms. If you do not agree with this disclaimer, please do not use the website.
www.serrarigroup.com, reserves the right to update, modify, or remove any part of this disclaimer without prior notice. It is your responsibility to review this disclaimer periodically for changes.
Serrari Group 2025